Category: Uncategorized

The End Of OPEC Is Near

The End Of OPEC Is Near

via The Global Warming Policy Forum (GWPF)
http://www.thegwpf.com

OPEC, which has far exceeded the average life of cartels, is on the brink of failure.

OPEC_cartoon_02.16.2016

Though cracks have been developing in the cartel since the start of the current oil crisis, the group has managed to stay together so far. Nevertheless, the success of the current OPEC deal for production cuts will decide its future as a cartel.

What is a cartel?

A cartel is a group of like-minded producers, who act in concert—or collusion—to achieve a shared goal of increasing their profits by means of restricting supply, fixing prices, or destroying their competition by illegal means. The average life of the 20th Century cartels has been 3.7 to 7.5 years, according to various studies by Margaret Levenstein and Valerie Suslow. In the past two centuries, cartels have been able to influence prices by an average of 25 percent.

History of OPEC’s success in boosting oil prices

Since its inception, OPEC has been fairly successful in boosting prices by various means. A few of the price increases, however, were due to reasons other than direct OPEC action, nevertheless benefitting their members.

Though the 1973 oil embargo was brought on by political reasons, OPEC used the production cuts of the embargo to boost oil prices from $3 a barrel in 1973 to $12 a barrel in 1974.

The 1979 energy crisis was not a brainchild of OPEC. The production dropped due to the Iran-Iraq war, and the price of oil doubled in about 12 months, again benefitting OPEC members.

OPEC was able to boost prices using production quotas and production cuts following the Asian Financial Crisis in 1997.

What has OPEC done to support oil prices in the current oil crisis?

OPEC, as any cartel would, has used two strategies to influence oil prices. However, both have been unsuccessful in achieving their objectives.

In 2014, Saudi Arabia, the de facto leader of OPEC, attempted to stifle the competition of the shale oil drillers by keeping their production intact. As a result, oil prices plummeted to multi-year lows of about $27 a barrel in February 2016. The drop in oil prices saw 119 North American oil and gas producers file for bankruptcy from the beginning of 2015, according to Haynes and Boone, LLP.

U.S. oil production dropped about 883,000 barrels a day by August 2016, after topping out at 9.7 million barrels a day in April 2015. Nevertheless, the price decrease went well below OPEC’s expectations. Meanwhile, many shale oil drillers used a combination of better technology and hedging to continue pumping oil, despite the low prices.

As its first strategy failed to effect the U.S. shale oil production to the extent presumed, OPEC then adopted a second strategy of cutting production. On November 30, OPEC sealed a deal to cut production after months of difficult negotiation. Though prices bounced and broke out of the $52 levels – a strong resistance – they could not reach the $60 levels preferred by OPEC members.

However, this modest rally in crude oil prices rejuvenated the U.S. shale oil drillers, and U.S. oil production is now on the rise. As a result, crude oil has dipped again and is hovering near the $50 per barrel level.

The market believes that if crude oil prices remain above $50 per barrel, U.S. shale oil production will increase. For this reason, OPEC is finding itself in a catch-22 situation: It is losing market share to the U.S. shale oil drillers, but it is unable to propel prices considerably higher. It is losing its ability to influence prices above a certain level.

Full post

via The Global Warming Policy Forum (GWPF) http://www.thegwpf.com

April 3, 2017 at 02:28AM

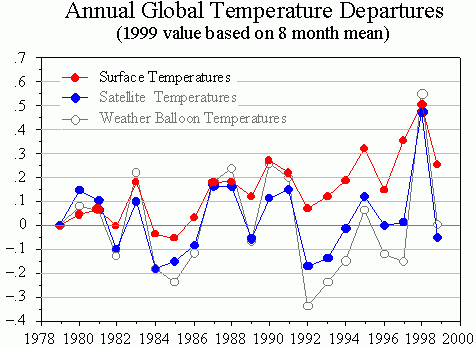
The ground measurement data supporting the AGW Theory is very suspect

screen-shot-2016-12-28-at-6-41-45-am

  1.  Ground measurements are continually subject to opaque “adjustments.”
  2. Ground measurements do not correlate well with Satellite and Balloon measurements.
  3. Satellite data shows no significant warming since 1997, and much of the warming is clearly due to El Nino caused temperature spikes.
  4. CO2 has substantially increased during this period that is referred to as “the pause.”
  5. The data adjustments aren’t similar to adjustments for random errors, where the adjustments are also random in nature. Temperature “adjustments” almost universally increase the slope of the temperature graph, lowering distal and elevating proximal data. The result is to suspiciously make the temperature increase more linear and in line with the CO2 increase.

Britain’s drivers count the cost of Labour’s diesel folly 

Britain’s drivers count the cost of Labour’s diesel folly 

via Tallbloke’s Talkshop
http://ift.tt/1WIzElD


An embarrassing U-turn by the promoters of pointless carbophobia as diesel cars get the role of public enemy.
H/T Daily Mail via GWPF

It’s less than 20 years since the Labour government – backed by the vociferous green lobby and most of the scientific community – urged motorists to abandon their nasty, carbon-emitting, petrol-engine cars and convert to diesel.

With hindsight, looking at the names of the politicians who pushed this revolution – John Prescott, Neil Kinnock (then EU Transport Commissioner), Gordon Brown – we should have known it would end in tears. But at the time we were assured that driving a diesel was good for the planet and buying one was doing a public service.

With the help of generous tax incentives, the number of diesel vehicles on our roads rocketed from just over 6 per cent of the total in 1990 to around 40 per cent. Diesel cars have increased in number on British roads from six per cent in 1990 to around 40 per cent today as a result of favourable tax policies introduced by Labour politicians.

But how dramatically things have changed. In what seems like no time, diesel drivers have gone from being public-spirited citizens to demons. They are now told their cars are a menace, spewing out nitrous oxides and toxic particles and contributing to the deaths of thousands of people every year.

One pressure group describes the rise of diesel as ‘the biggest health catastrophe since the Black Death’. And to complete their misery, there are plans to penalise diesel motorists by charging them up to £20 a day to drive in 35 towns and cities across England.

They have a perfect right to be furious. Through no fault of their own they are being fleeced and of course the poorest, who don’t have the option of changing to a car with lower emissions, will be hardest hit.

Source: Britain’s Drivers Count The Cost Of Labour’s Diesel Folly | The Global Warming Policy Forum (GWPF)

via Tallbloke’s Talkshop http://ift.tt/1WIzElD

April 3, 2017 at 01:51AM

UAH Global Temperature Update for March, 2017: +0.19 deg. C

UAH Global Temperature Update for March, 2017: +0.19 deg. C

via Roy Spencer, PhD.
http://ift.tt/1o1jAbd

The Version 6.0 global average lower tropospheric temperature (LT) anomaly for March, 2017 was +0.19 deg. C, down from the February, 2017 value of +0.35 deg. C (click for full size version):

The global, hemispheric, and tropical LT anomalies from the 30-year (1981-2010) average for the last 15 months are:

YEAR MO GLOBE NHEM. SHEM. TROPICS
2016 01 +0.54 +0.69 +0.39 +0.84
2016 02 +0.83 +1.16 +0.50 +0.98
2016 03 +0.73 +0.94 +0.52 +1.08
2016 04 +0.71 +0.85 +0.58 +0.93
2016 05 +0.54 +0.64 +0.44 +0.71
2016 06 +0.33 +0.50 +0.17 +0.37
2016 07 +0.39 +0.48 +0.29 +0.47
2016 08 +0.43 +0.55 +0.31 +0.49
2016 09 +0.44 +0.49 +0.38 +0.37
2016 10 +0.40 +0.42 +0.39 +0.46
2016 11 +0.45 +0.40 +0.50 +0.37
2016 12 +0.24 +0.18 +0.30 +0.21
2017 01 +0.30 +0.26 +0.33 +0.07
2017 02 +0.35 +0.54 +0.15 +0.05
2017 03 +0.19 +0.30 +0.07 +0.03

The cooling in March occurred virtually everywhere, with 23 of the 26 subregions we track having cooler anomalies than in February.

The UAH LT global anomaly image for March, 2017 should be available in the next few days here.

The new Version 6 files should also be updated soon, and are located here:

Lower Troposphere: http://ift.tt/2gVtMDe
Mid-Troposphere: http://ift.tt/2gCPmk0
Tropopause: http://ift.tt/2gVrWCC
Lower Stratosphere: http://ift.tt/2gCN2tc

via Roy Spencer, PhD. http://ift.tt/1o1jAbd

April 3, 2017 at 01:08AM