
‘Several Thousand’ Hot (60°C) Springs ‘All Over’
Greenland Melt The Ice Sheet From Bottom Up

A few years ago, 10 glaciologists publishing in the journal Nature Geoscience asserted that “large parts of the north-central Greenland ice sheet are melting from below” due to high geothermal heat flux forcing (Rogozhina et al., 2016).
In a new paper published in Scientific Reports, 4 more glaciologists (Rysgaard et al., 2018) report that “hot vents” (or hot springs) of geothermally-heated water underneath the Greenland ice sheet can explain localized rising temperatures and glacial melting.
Water Temperatures Beneath Greenland Reach 55-62°C, Over Halfway To Boiling
Water temperatures of these natural hot springs reach into the 60°C (140°F) range, and there are “several thousands“ of them “all over Greenland“, with observations of high geothermal heat/ice-melt locations spanning the East, West, North, South, and Central regions of this glaciated island.
It’s instructive to put these subsurface hot spring water temperatures (reaching a sweltering 55-62 °C) into perspective.
Greenland’s surface air temperature averages about -28 °C year-round, and the coastal water temperatures routinely hover around 0.0 °C (32.0 °F) during the summer.
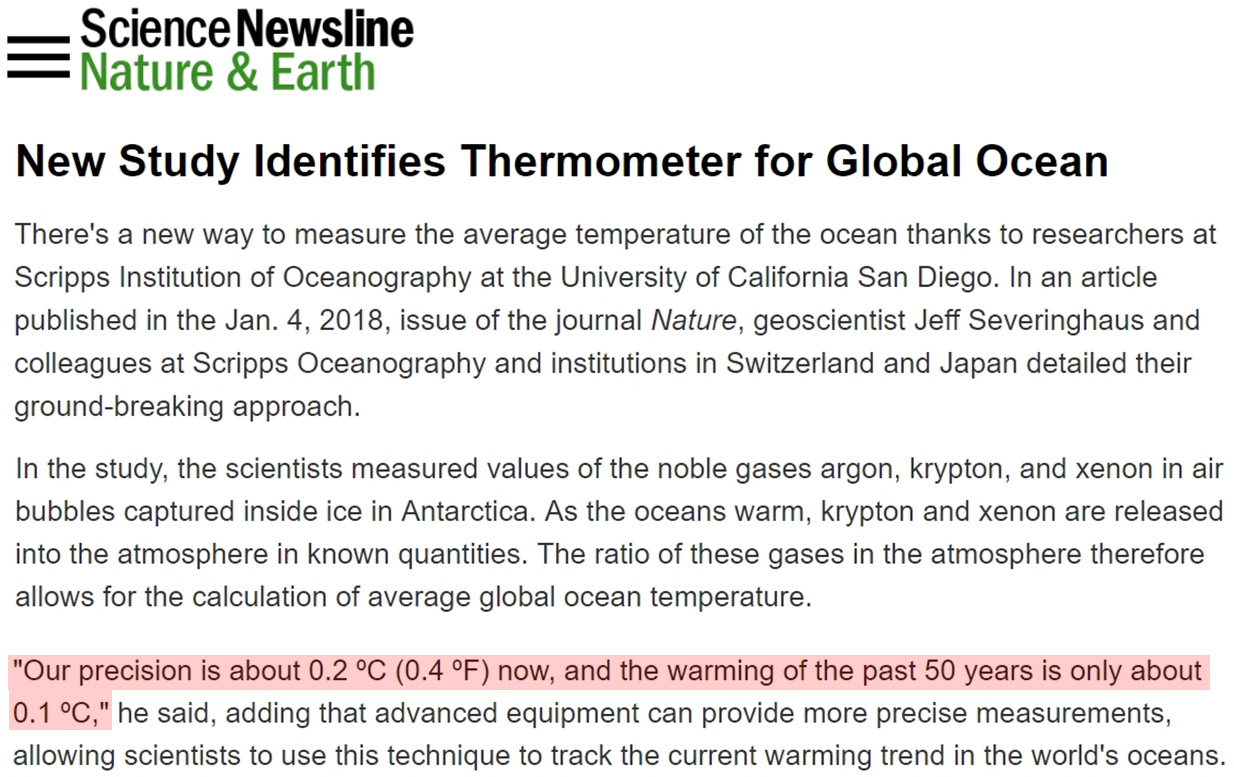
Consider that over the last 50 years the global oceans are alleged to have warmed by “only about 0.1°C” in total (Bereiter et al., 2018). That’s a change of one-tenth of one degree Celsius over 5 decades that climate scientists sympathetic to the anthropogenic global warming (AGW) cause claim could be heavily responsible for the change in Greenland’s glaciated landscape.
Compare this tiny 50-year accumulation of thermal change to the range or variations in the natural, halfway-to-boiling heat source directly beneath the Greenland Ice Sheet.
Interestingly, the role of anthropogenic CO2 emissions in Greenland’s glacier dynamics is not mentioned in the paper.
The Greenland Ice Sheet Has Not Been Complying With The AGW Narrative
Consider these recently-determined scientific conclusions pertaining to the Greenland Ice Sheet.
(a) Greenland was 3 to 5 °C warmer with 40 kilometers less ice area 4,000-10,000 years ago (Mangerud and Svendsen, 2017, Lasher et al., 2017, Kobashi et al., 2017).
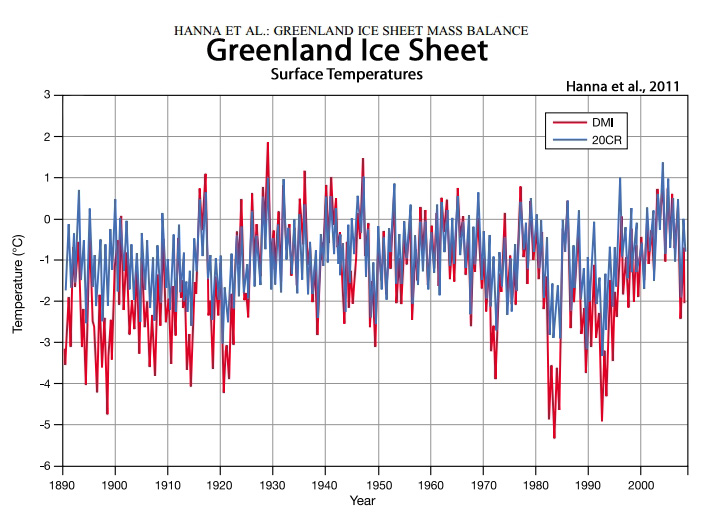
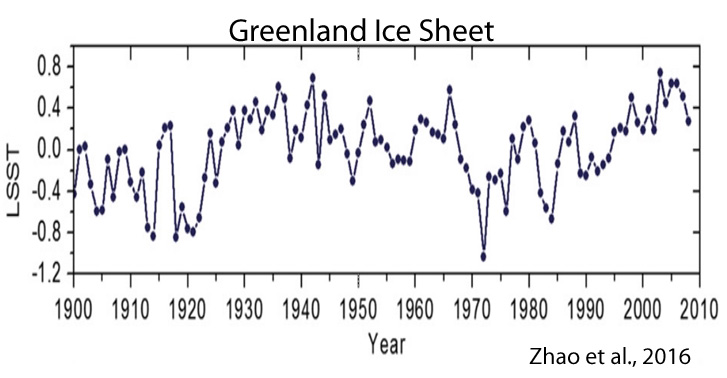
(b) There has been no net warming of the Greenland Ice Sheet in the last 80 years (Hanna et al., 2011; Zhao et al., 2016).
(c) Melted ice from the Greenland Ice Sheet has contributed only 1.5 centimeters (0.6 of an inch) to global sea level rise since 1900 (Fettweis et al., 2017), with no (zero) net sea level rise contribution between the 1940s and the early 2000s.
(d) Melted ice from the Greenland Ice Sheet contributed only 0.39 of a centimeter (0.15 of an inch) to global sea levels between 1993 and 2010 (Leeson et al, 2017).
(e) “[T]he interior of the GrIS [Greenland Ice Sheet] is flowing 95% slower now than it was on average during the Holocene.” (MacGregor et al., 2016)
(f) Greenland has been cooling slightly since 2005 (Kobashi et al., 2017).
(g) And now it has been determined that the regional locations where warming and ice-melt has occurred on the Greenland Ice Sheet can be primarily attributed to high geothermal heat flux forcing.
The scientific evidence continues to accumulate supporting the position that the Greenland Ice Sheet has not been following the modeled expectations of the anthropogenic global warming narrative.
Rysgaard et al., 2018
High geothermal heat flux in close proximity
to the Northeast Greenland Ice Stream
Abstract/Summary
“The Greenland ice sheet (GIS) is losing mass at an increasing rate due to surface melt and flow acceleration in outlet glaciers. … Recently it was suggested that there may be a hidden heat source beneath GIS caused by a higher than expected geothermal heat flux (GHF) from the Earth’s interior. Here we present the first direct measurements of GHF from beneath a deep fjord basin in Northeast Greenland. Temperature and salinity time series (2005–2015) in the deep stagnant basin water are used to quantify a GHF of 93 ± 21 mW m−2 which confirm previous indirect estimated values below GIS. A compilation of heat flux recordings from Greenland show the existence of geothermal heat sources beneath GIS and could explain high glacial ice speed areas such as the Northeast Greenland ice stream.”
‘Several Thousands’ Geothermal Hot Springs ‘All Over Greenland’ With Source Water Temperatures Of Up To ~60°C
• “Geothermal springs with source water temperatures above 0 °C have been found all over Greenland, especially around Disko Island in West Greenland, where several thousands of such springs have been identified.”
• “However, the hottest springs, with source water temperatures of 55-62 °C are found in East Greenland at a number of locations north and south of Scoresbysund.”
• “East Greenland constitutes a volcanic rifted margin that forms part of the Tertiary North Atlantic Igneous Province.”
• “Combining our measurements with other sites of reported geothermal activity around Greenland clearly shows that East Greenland is a hotspot. Several hot vents exist on land, with temperatures ranging from 15 to 62 °C and a tendency to increase northeastwards.”
Vertical (Bottom-Up) Heating From Geothermal Activity Beneath Greenland Are ‘Primary Processes’ Responsible For 2005-2015 Warming
• “Overall, there has been a gradual warming of the stagnant deep basin bottom water below 240 m depth of 0.017 °C yr−1 from 2005 to 2015.”
• “[T]he gradual temperature increase during 2006–2015 and the spatial distribution of Δθ strongly indicate that bottom water temperatures increase due to a large GHF [geothermal heat flux] in the “Dybet” section. Therefore, we assume that vertical turbulent mixing and GHF [geothermal heat flux] are the primary processes behind the observed salinity and temperature change.”

‘Hot Vents’ In West, South, North, East, Center Greenland Also Observed Where Rapid Glacier Mass Losses Are Occurring
• “High glacier surface speeds and negative mass balance are also observed near other hot vents in West Greenland such as the Jakobshavn Isbræ (69°N) near Disko Island;”
• “[T]he Narssaq bræ, Valhaltinde glacier, Nordbo glacier and Qassimiut ice lobe in South Greenland all show negative ice mass balances near the hot vent in Uunartoq (60°N);”
• “[I]n East Greenland the Helheim glacier, Isertoq and Mittivakkat glaciers located near Ikasagitavaq (66°N) are losing mass, and high ice speed is also observed at the Kangerdlugssuaq glacier where a GHF [geothermal heat flux] of 70–80 mW m−2 has been recorded (68°N).”
• “In addition, a GHF value of 135 mW m−2 has been reported at NGRIP [North Greenland].”
• “A GHF anomaly of up to 88 mW m−2 was modeled to be located at the head of the 750-km-long Northeast Greenland ice stream. … Our recorded GHF of 93 mW m−2 in the Young Sound-Tyrolerfjord is located in this GHF hotspot and supports their model results. Hence, this part of Greenland may play a role for the rapid basal melt located at the head of the Northeastern Greenland ice stream and its high ice speeds.”
• “[T]his accumulated evidence point to active geothermal activity in the northeastern corner of Greenland and indicate that geothermal heat source may exist below the center and northeastern part of GIS. This heat source may explain the origin of the Northeast Greenland ice stream and other areas with high ice stream speed.”
via NoTricksZone
January 24, 2018 at 08:29AM

One thought on “Groundbreaking AGW-Undermining Study: Greenland’s Warming, Ice Loss Due To Geothermal Heat”