
 First a note:
If you haven’t already picked up a copy of the The Politically Incorrect Guide to Climate Change, please do get your hands on one.
According to its author Marc Morano, people have been snatching them up and a third printing has started. The book even made the Amazon top 100 best selling books for awhile.
It also ranked first in a number of categories. In his book, NoTricksZone gets mentioned 4 times and even took up one full page at one spot!
So now on to today’s post…
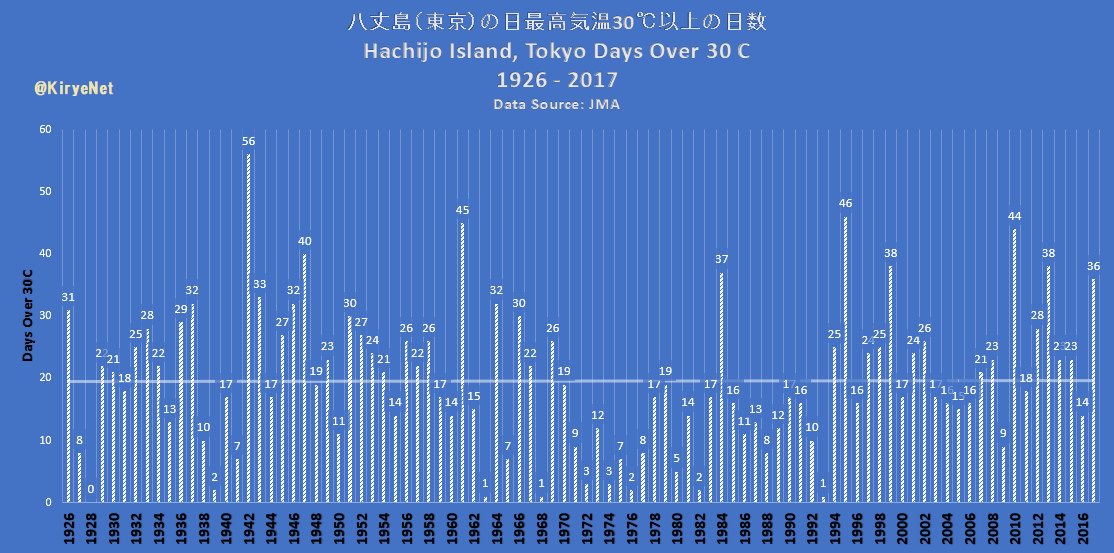
Less heat days near Tokyo
As in Germany, a heat day in Japan is defined as one reaching 30°C or higher.
And according to the manmade CO2 theory, global temperatures are supposed to be rising rapidly and hence we should be seeing many more “heat days” than say 50 or 100 years ago.
Yet Japanese blogger Kirye presents data over Hachijo Island, out to sea east of Tokyo, a location shielded from the urban heat island effect, which tell us that more heat days is not the case at all:
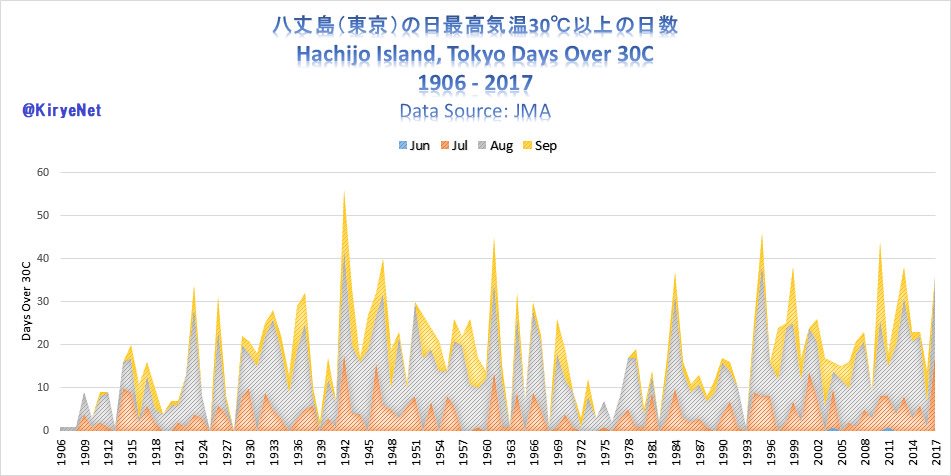
Kirye writes, when looking at the past 111 years, the trend in Hachijo Island’s number of days over 30℃ from 1906 to 2017 “denies the anthropogenic global warming hypothesis” and that it does not support the myth of a widespread man-made climate change.
No trend in the city of Tokyo
Also the last 24 years in the city Tokyo show no trend, and even a declining trend since 2010:
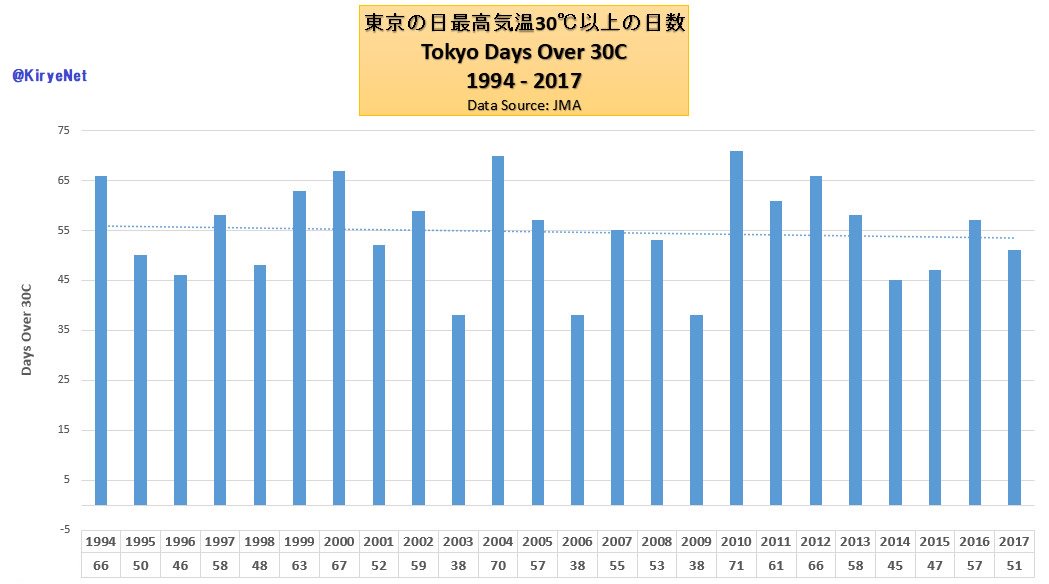
Data source: Japanese Meteorological Agency (JMA)
What follows is the month-by-month breakdown, May to October:
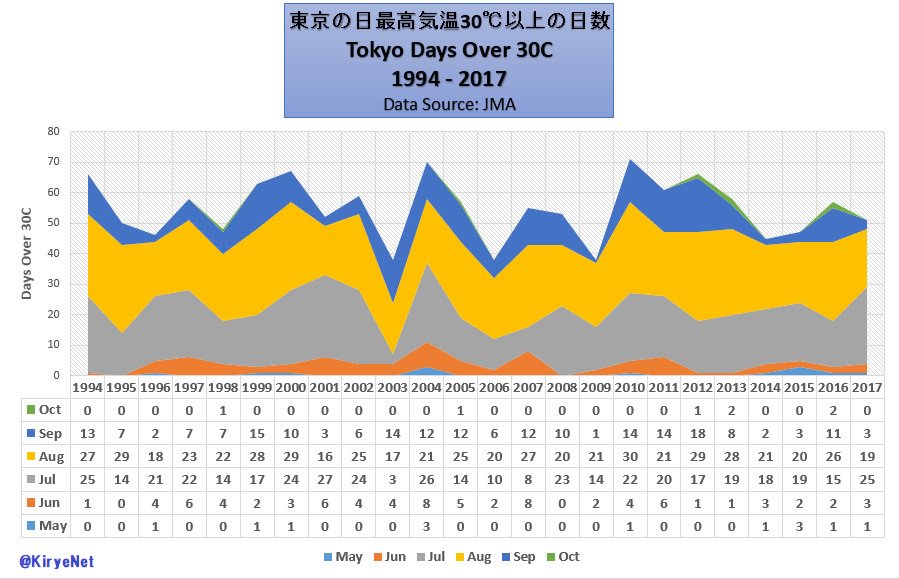
Data Source: www.data.jma.go.jp/
via NoTricksZone
April 7, 2018 at 08:09AM
