
Holocene Sea Levels were 2 Meters Higher
1. Are Modern ‘Anthropogenic’ Sea Levels Rising At An Unprecedented Rate? No.
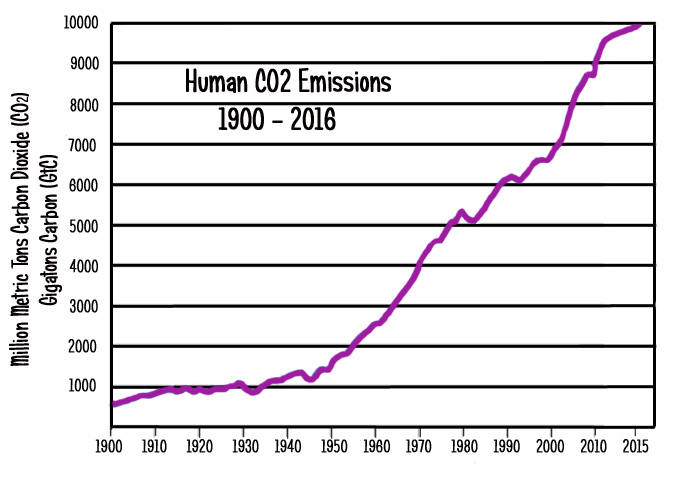
Despite the surge in CO2 concentrations since 1900, the UN’s Intergovernmental Panel on Climate Change (IPCC) has concluded that global sea levels only rose by an average of 1.7 mm/yr during the entire 1901-2010 period, which is a rate of just 0.17 of a meter per century.
During the 1958 to 2014 period, when CO2 emissions rose dramatically, a recent analysis revealed that the rate of sea level rise slowed to between 1.3 mm/yr to 1.5 mm/yr, or just 0.14 of a meter per century.
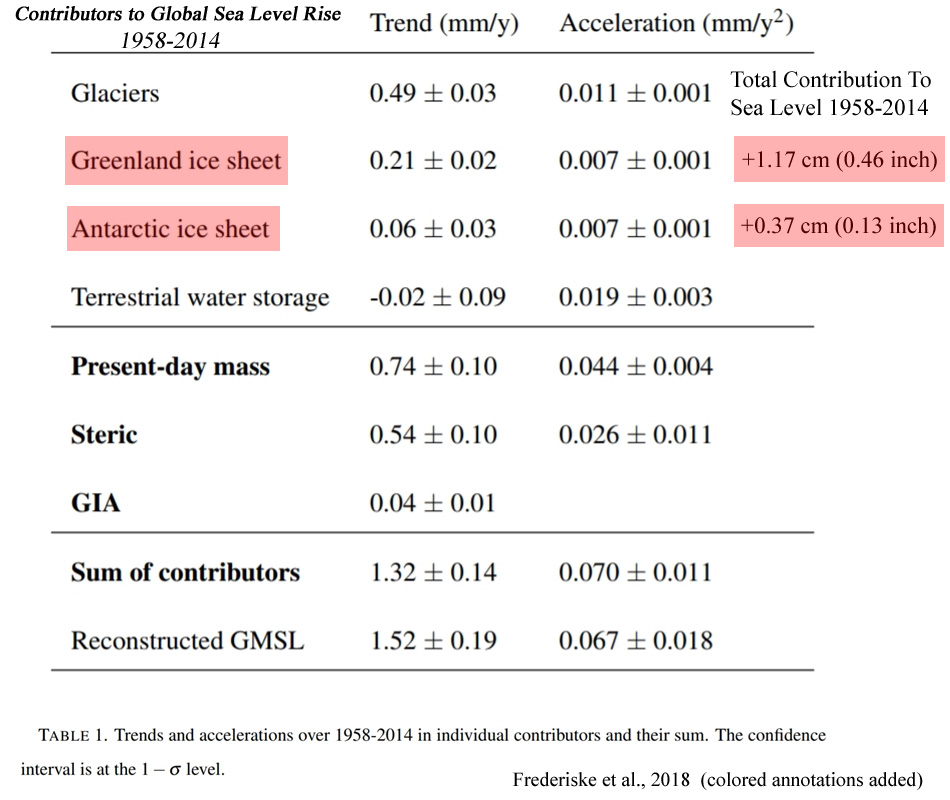
Frederiske et al.,2018 “Anthropogenic” Global Sea Level Rise Rate (1958-2014): +0.14 of a meter per century
“For the first time, it is shown that for most basins the reconstructed sea level trend and acceleration can be explained by the sum of contributors, as well as a large part of the decadal variability. The global-mean sea level reconstruction shows a trend of 1.5 ± 0.2 mm yr−1 over 1958–2014 (1σ), compared to 1.3 ± 0.1 mm yr−1 for the sum of contributors.”
2. ~15,000 – 11,000 Years Ago, Sea Levels Rose At Rates Of +4 to +6 Meters Per Century
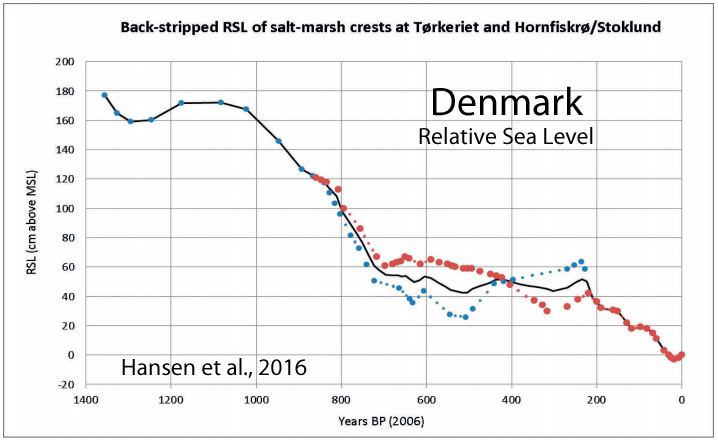
In the past few thousand years, sea levels in some regions rose and fell at rates of + or – 0.5 to 1.1 meters per century. Sea levels during the Medieval Warm Period were+170 centimeters higher than today.
Hansen et al., 2016 Denmark, +1.7 meters higher than present during the Medieval Warm Period

Abstract
Low-lying reef islands on the rim of atolls are perceived as particularly vulnerable to the impacts of sea-level rise. Three effects are inferred: erosion of the shoreline, inundation of low-lying areas, and saline intrusion into the freshwater lens. Regional reconstruction of sea-level trends, supplementing the short observational instrumental record, indicates that monthly mean sea level is rising in the eastern Indian and western Pacific Oceans. This paper reviews the morphology and substrate characteristics of reef islands on Indo-Pacific atolls, and summarises their topography. On most atolls across this region, there is an oceanward ridge built by waves to a height of around 3 m above MSL; in a few cases these are topped by wind-blown dunes. The prominence of these ridges, together with radiocarbon dating and multi-temporal studies of shoreline position, indicate net accretion rather than long-term erosion on most of these oceanward shores. Less prominent lagoonward ridges occur, but their morphology and continuity are atoll-specific, being a function of the processes operating in each lagoon. Low-lying central areas are a feature of many islands, often locally excavated for production of taro. These lower-lying areas are already subject to inundation, which seems certain to increase as the sea rises. Tropical storms play an important role in the geomorphology of reef islands in those regions where they are experienced. Topographical differences, as well as features such as emergence of the reef flat and the stability of the substrate, mean that islands differ in terms of their susceptibility to sea-level rise. Further assessment of variations in shoreline vulnerability based on topography and substrate could form the basis for enhancing the natural resilience of these islands.
Link to paper (paywall) is here
h/t to Purakanui
</div> ” data-medium-file=”” data-large-file=”” class=”alignnone size-medium wp-image-20139″ src=”https://i0.wp.com/climatechangedispatch.com/wp-content/uploads/2018/04/Holocene-Cooling-Sea-Level-Denmark-Hansen-2016-Anthropogenic-2.jpg?resize=500%2C272&ssl=1″ alt=””/>
“Continuous record of Holocene sea-level changes … (4900 years BP to present). … The curve reveals eight centennial sea-level oscillations of 0.5-1.1 m superimposed on the general trend of the RSL [relative sea level] curve [relative sea levels ~1.7 m higher than present from 1400 to 1000 years ago].”
Cronin et al., 2017 Global Sea Level Rise Rate: +4 meters per century (14,500 to 14,000 years ago)
“Rates and patterns of global sea level rise (SLR) following the last glacial maximum (LGM) are known from radiometric ages on coral reefs from Barbados, Tahiti, New Guinea, and the Indian Ocean, as well as sediment records from the Sunda Shelf and elsewhere. … Lambeck et al. (2014) estimate mean global rates during the main deglaciation phase of 16.5 to 8.2 kiloannum (ka) [16,500 to 8,200 years ago] at 12 mm yr−1 [+1.2 meters per century] with more rapid SLR [sea level rise] rates (∼ 40 mm yr−1) [+4 meters per century] during meltwater pulse 1A ∼ 14.5–14.0 ka [14,500 to 14,000 years ago].”
Abdul et al., 2017 Global Sea Level Rise Rate: +4 meters per century(11,450 to 11,100 years ago)
“We find that sea level tracked the climate oscillations remarkably well. Sea-level rise was fast in the early Allerød (25 mm yr-1), but decreased smoothly into the Younger Dryas (7 mm yr-1) when the rate plateaued to <4 mm yr-1here termed a sea-level “slow stand”. No evidence was found indicating a jump in sea level at the beginning of the Younger Dryas as proposed by some researchers. Following the “slow-stand”, the rate of sea-level rise accelerated rapidly, producing the 14 ± 2 m sea-level jump known as MWP-1B; occurred between 11.45 and 11.1 kyr BP with peak sea-level rise reaching 40 mm yr-1 [+4 meters per century].”
Ivanovic et al., 2017 Northern Hemisphere Sea Level Rise Rate: +3.5 to +6.5 meters per century (~14,500 years ago)
“During the Last Glacial Maximum 26–19 thousand years ago (ka), a vast ice sheet stretched over North America [Clark et al., 2009]. In subsequent millennia, as the climate warmed and this ice sheet decayed, large volumes of meltwater flooded to the oceans [Tarasov and Peltier, 2006; Wickert, 2016]. This period, known as the “last deglaciation,” included episodes of abrupt climate change, such as the Bølling warming [~14.7–14.5 ka], when Northern Hemisphere temperatures increased by 4–5°C in just a few decades [Lea et al., 2003; Buizert et al., 2014], coinciding with a 12–22 m sea level rise in less than 340 years [3.5 to 6.5 meters per century] (Meltwater Pulse 1a (MWP1a)) [Deschamps et al., 2012].”
Zecchin et al., 2015 Regional Sea Level Rise Rate: +6 meters per century(14,500-11,500 years ago)
“[M]elt-water pulses have punctuated the post-glacial relative sea-level rise with rates up to 60 mm/yr. [6 meters per century] for a few centuries.”
3. Over 70 Papers Affirm Sea Levels Were 2+ Meters Higher Than Now A Few Thousand Years Ago When CO2 Levels Were ‘Safe’
70+ Papers: Sea Levels 2+ m Higher 9,000-4,000 Years Ago While CO2 Levels Were ‘Safe’ (265 ppm) More Here
Before the advent of the industrial revolution in the late 18th to early 19th centuries, carbon dioxide (CO2) concentrations hovered between 260 to 280 parts per million (ppm).

</td> </tr> </tbody> </table> <p>“The ice loss that we see today — the ice loss that started in the early 20th Century and sped up during the last 30 years — appears to be unmatched over at least the last few thousand years,” said <a href="http://bprc.osu.edu/geo/polyak.php">Leonid Polyak</a>, a research scientist at <a href="http://bprc.osu.edu/">Byrd Polar Research Center</a> at Ohio State University. Polyak is lead author of the paper and a preceding report that he and his coauthors prepared for the <a href="http://www.globalchange.gov/">U.S. Climate Change Science Program</a>.</p> <p>Satellites can provide detailed measures of how much ice is covering the pole right now, but sediment cores are like fossils of the ocean’s history, he explained.</p> <p>“Sediment cores are essentially a record of sediments that settled at the sea floor, layer by layer, and they record the conditions of the ocean system during the time they settled. When we look carefully at various chemical and biological components of the sediment, and how the sediment is distributed — then, with certain skills and luck, we can reconstruct the conditions at the time the sediment was deposited.”</p> <p>For example, scientists can search for a biochemical marker that is tied to certain species of algae that live only in ice. If that marker is present in the sediment, then that location was likely covered in ice at the time. Scientists call such markers “proxies” for the thing they actually want to measure — in this case, the geographic extent of the ice in the past.</p> <p>While knowing the loss of surface area of the ice is important, Polyak says that this work can’t yet reveal an even more important fact: how the total volume of ice — thickness as well as surface area — has changed over time.</p> <blockquote><p><span we look carefully at various chemical and biological components of the seafloor sediment, and how the sediment is distributed — then, with certain skills and luck, we can reconstruct the conditions at the time the sediment was deposited.”</span></p></blockquote> <p>“Underneath the surface, the ice can be thick or thin. The newest satellite techniques and field observations allow us to see that the volume of ice is shrinking much faster than its area today. The picture is very troubling. We are losing ice very fast,” he said.</p> <p>“Maybe sometime down the road we’ll develop proxies for the ice thickness. Right now, just looking at ice extent is very difficult.”</p> <p>To review and combine the data from hundreds of studies, he and his cohorts had to combine information on many different proxies as well as modern observations. They searched for patterns in the proxy data that fit together like pieces of a puzzle.</p> <p>Their conclusion: the current extent of Arctic ice is at its lowest point for at least the last few thousand years.</p> <p>As scientists pull more sediment cores from the Arctic, Polyak and his collaborators want to understand more details of the past ice extent and to push this knowledge further back in time.</p> <p>During the summer of 2011, they hope to draw cores from beneath the Chukchi Sea, just north of the Bering Strait between Alaska and Siberia. The currents emanating from the northern Pacific Ocean bring heat that may play an important role in melting the ice across the Arctic, so Polyak expects that the history of this location will prove very important. He hopes to drill cores that date back thousands of years at the Chukchi Sea margin, providing a detailed history of interaction between oceanic currents and ice.</p> <p>“Later on in this cruise, when we venture into the more central Arctic Ocean, we will aim at harvesting cores that go back even farther,” he said. “If we could go as far back as a million years, that would be perfect.”</p> <p>Polyak’s coauthors on the report hailed from Penn State University, University of Colorado, University of Massachusetts, the U.S. Geological Survey, Old Dominion University, the Geological Survey of Canada, University of Copenhagen, the Cooperative Institute for Research in Environmental Sciences, Stockholm University, McGill University, James Madison University, and the British Antarctic Survey.</p> <p>This research was funded by the <a href="http://www.usgs.gov/">US Geological Survey</a> and the <a href="http://www.nsf.gov/">National Science Foundation</a>.</p> <p>#</p> <p>Contact: Leonid Polyak, (614) 292-2602; <a href="mailto:Polyak.1@osu.edu">Polyak.1@osu.edu</a></p> <p>Written by Pam Frost Gorder, (614) 292-9475; <a href="mailto:Gorder.1@osu.edu">Gorder.1@osu.edu</a></p> ” data-medium-file=”” data-large-file=”” class=”alignnone size-medium wp-image-20140″ src=”https://i2.wp.com/climatechangedispatch.com/wp-content/uploads/2018/04/Holocene-CO2-10500-Years-Ago-to-1800-AD.jpg?resize=500%2C348&ssl=1″ alt=””/>
Within the last century, atmospheric CO2 concentrations have risen dramatically. Just recently they eclipsed 400 ppm.
Scientists like Dr. James Hansen have concluded that pre-industrial CO2 levels were climatically ideal. Though less optimal, atmospheric CO2 concentrations up to 350 ppm have been characterized as climatically “safe”.
However, CO2 concentrations above 350 ppm are thought to be dangerous to the Earth system. It is believed that such “high” concentrations could lead to rapid warming, glacier and ice sheet melt, and a harrowing sea level rise of 10 feet within 50 years.
To reach those catastrophic levels (10 feet within 50 years) predicted by proponents of sea level rise alarmism, the current “anthropogenic” change rate of +0.14 of a centimeter per year (since 1958) will need immediately explode into +6.1 centimeters per year.
The likelihood of this happening is remote, especially considering Greenland and Antarctica combined only contributed a grand total of 1.54 cm since 1958 (Frederiske et al., 2018).
It is becoming more and more apparent that sea levels rise and fall without any obvious connection to CO2 concentrations.
And if an anthropogenic signal cannot be conspicuously connected to sea level rise (as scientists have noted), then the greatest perceived existential threat promulgated by advocates of dangerous man-made global warming will no longer be regarded as even worth considering.
Read more at No Tricks Zone
