A video released by software expert Tony Heller exposes 30 years of completely false predictions made by NASA “climate experts” and how the predictions have no more value than what one could expect from crystal ball fortune-tellers.
When it comes to the climate debate, one could say he “floats like a butterfly, stings like a bee.”
Few skeptics are as hated and vilified by climate alarmists and global warming fraudsters as Tony Heller of Real Science.
One reason for the hatred is Tony’s voluminous stream of inconvenient climate facts and climate science fraud he exposes day after day at his Real Science blog.
Exposing false predictions and inconvenient climate history
Again and again Heller, a software and programming expert, effectively and convincingly points out that none of the scary predictions made by climate alarmists and media have come true, and that today’s often claimed unprecedented weather extremes have in fact happened many times and long before – even 100 years ago or more when CO2 was low.
As you are about to see, very often the OPPOSITE of what global warming alarmist scientists predicted years ago has in fact occurred. The degree to which the alarmist predictions have been wrong is nothing short of stunning.
Video viewed tens of thousands of times in just days
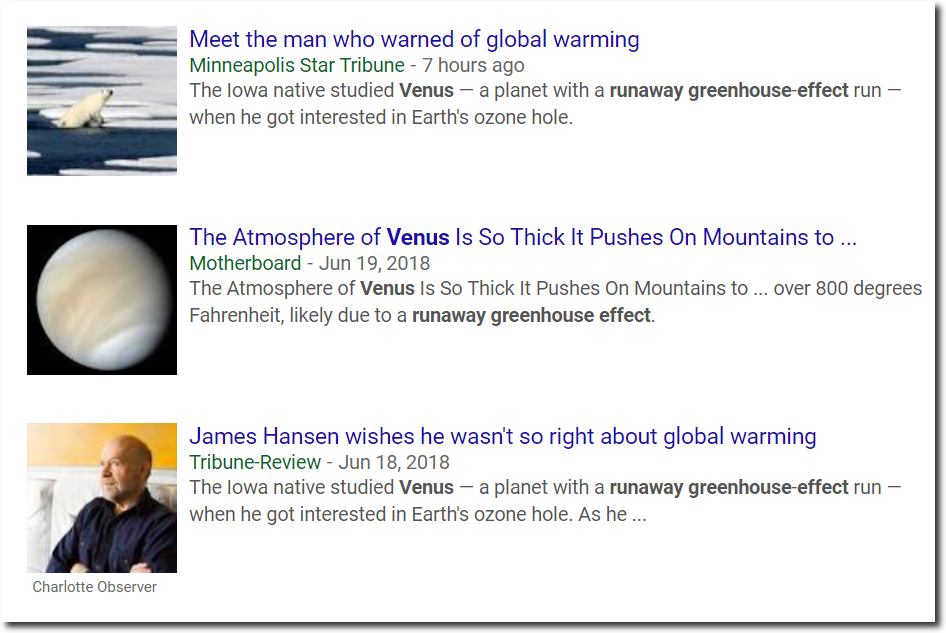
The latest is a 14-minute video that looks back at the past 30 years of totally failed climate predictions. Many were made by NASA scientist James Hansen when he testified before Congress in 1988 to warn the world of a coming climate disaster.
The video is a must-see if you haven’t viewed it already, and is certainly one that ought to be sent to your political representatives, or friends and relatives.
So far the video has viewed more than 33,000 views, and shows no signs of slowing down.
Hansen warned in 1988 of huge droughts and heat waves plaguing the US soon in the future, but in the video Heller shows how temperatures and drought conditions were in reality far worse back in the 1930s and in 1988 than they are today.
Hansen “dead wrong” about his drought forecast
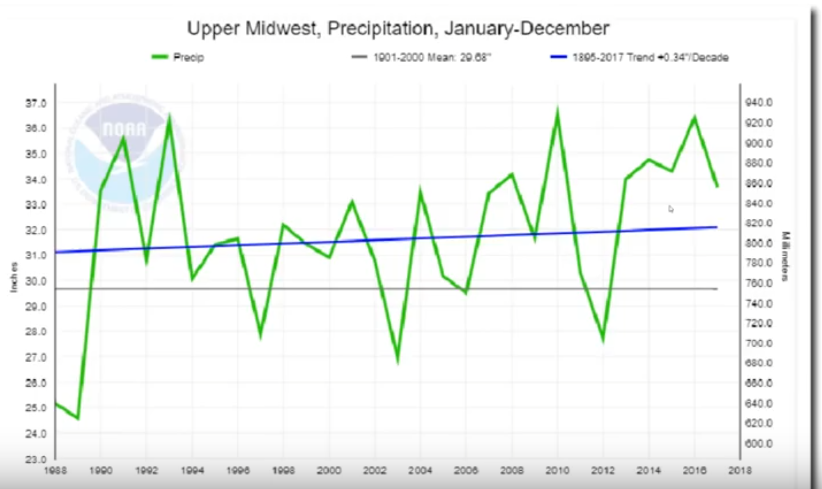
For example in 1988 NASA’s Hansen warned that his climate models (primitive compared to today’s models which still don’t work at all) showed the US Midwest would get drier and droughts more and more severe as time went on.
Yet, Heller presents a chart in the video that tells us the exact opposite has in fact happened since!
Source: Cropped here.
As Heller’s chart above shows, in the late 1980s it was very dry, but then right after Hansen’s testimony warning of more drought it suddenly got wet again. Moreover the last 5 years have been particularly moist. The exact opposite of what Hansen predicted is in fact occurring today.
Hot days have FALLEN
Hansen also warned that the number of hot days above 90°F (32°C) would increase dramatically to 85 days a year in Omaha. Nebraska and Washington D.C.
But in the chart that Heller presents at the 7:30 mark of the video, we see that the opposite has happened (arrows in all charts added by author):
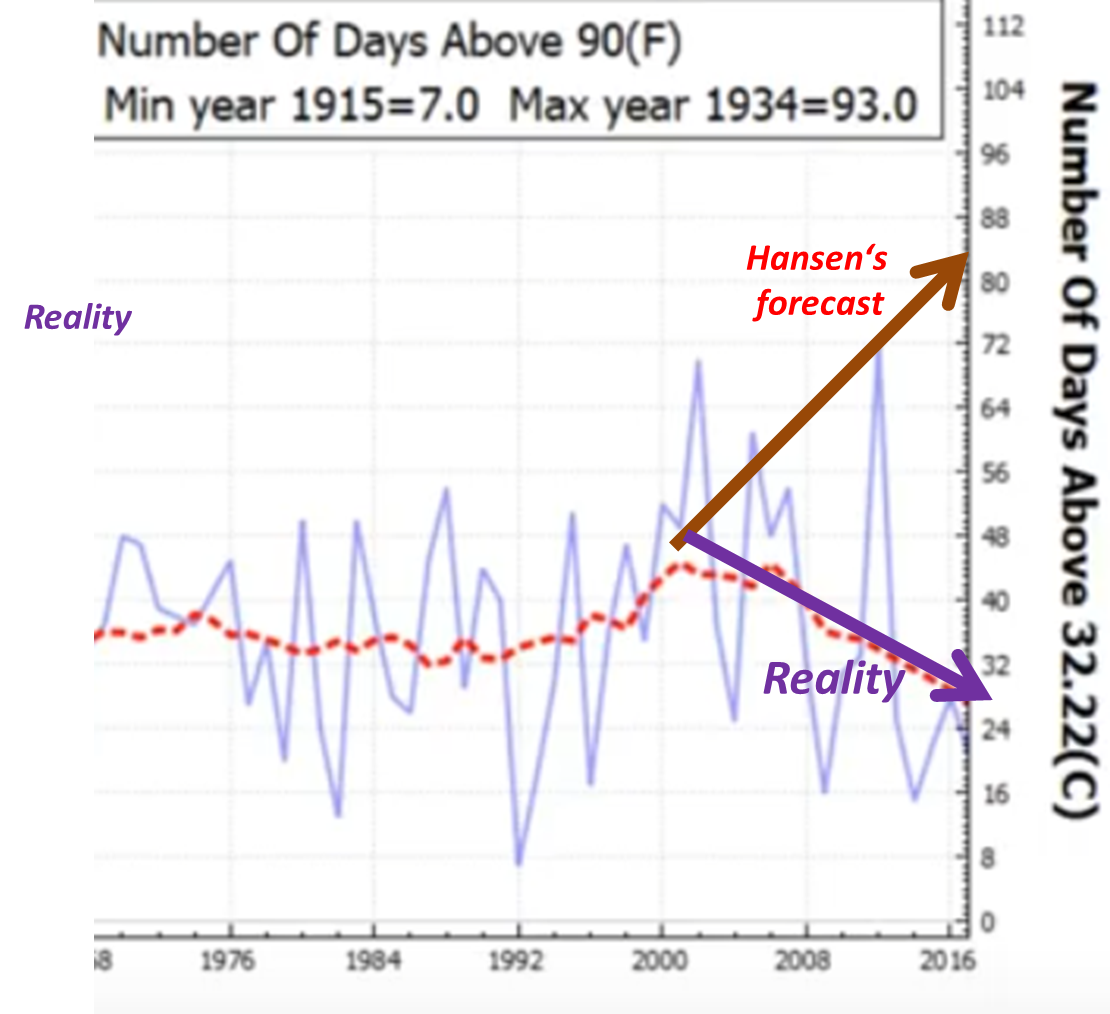
Source: Cropped here.
The number of days above 32°C for Ashland, Nebraska (near Omaha) have fallen over the past 20 years, and not risen as NASA’s James Hansen had forecast in 1988.
Hansen also “completely messed up” his forecast of 38°C+ days for Ashland (7:52), Heller shows:
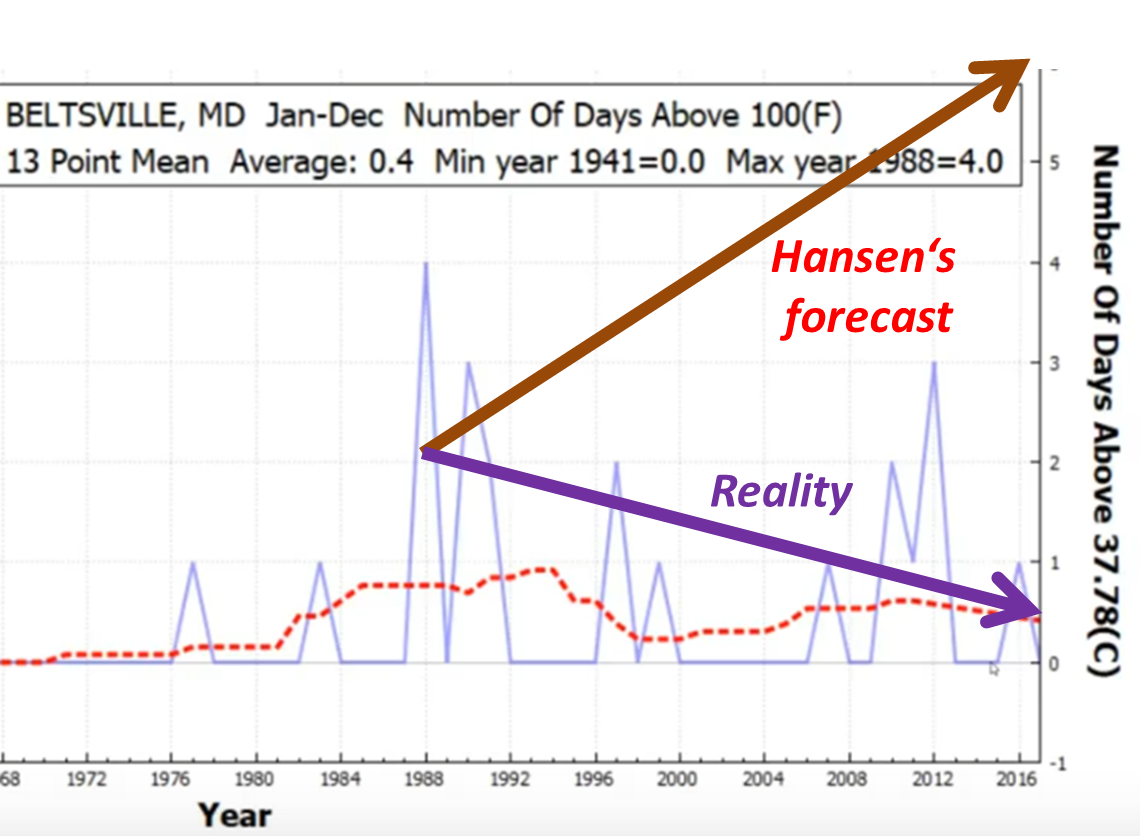
The number of very hot days (38°C or higher) for the Washington D.C. area each year has declined instead of rapidly rising as NASA’s GISS Head James Hansen projected in 1988. Source: Cropped here.
“Arctic ice has gotten much thicker over the past decade”
Hansen’s predictions concerning the Arctic have turned out to be equally awful. Though the Arctic saw ice loss until about 2010, it has since rebounded robustly, which means that it has nothing to do with CO2 concentrations in the atmosphere and more to do with natural cycles.
Totally messed up forecast
The chart he presents at the 9:00 minute mark shows a comparison between 2008 and today. Heller notes: “Instead of getting much thinner, the ice has gotten much thicker over the past decade. [….] Arctic sea ice volume is the thickest since 2005. […] Hansen totally messed up that forecast.”
Lake levels higher instead of lower
Next the experienced software expert looks at the levels of major lakes, which James Hansen said would drop to possibly dramatic levels. The reality today, however, is that they are higher!

The Great Lakes did not dry up and see their levels sink. They increased instead. Source: Cropped here.
The Great Lakes in the US are not drying out as Hansen predicted.
Sea level forecast totally botched
Next NASA’s Hansen warned in 1988 that melting polar and glacial ice would lead to rapidly rising sea levels and so New York City would be partially under water by now (2018). Al Gore also made a similar prediction in his movie, An Inconvenient Truth.
But as Heller points out, “Hansen completely messed up that forecast.” Nothing could be further from the truth, as the following chart vividly illustrates:
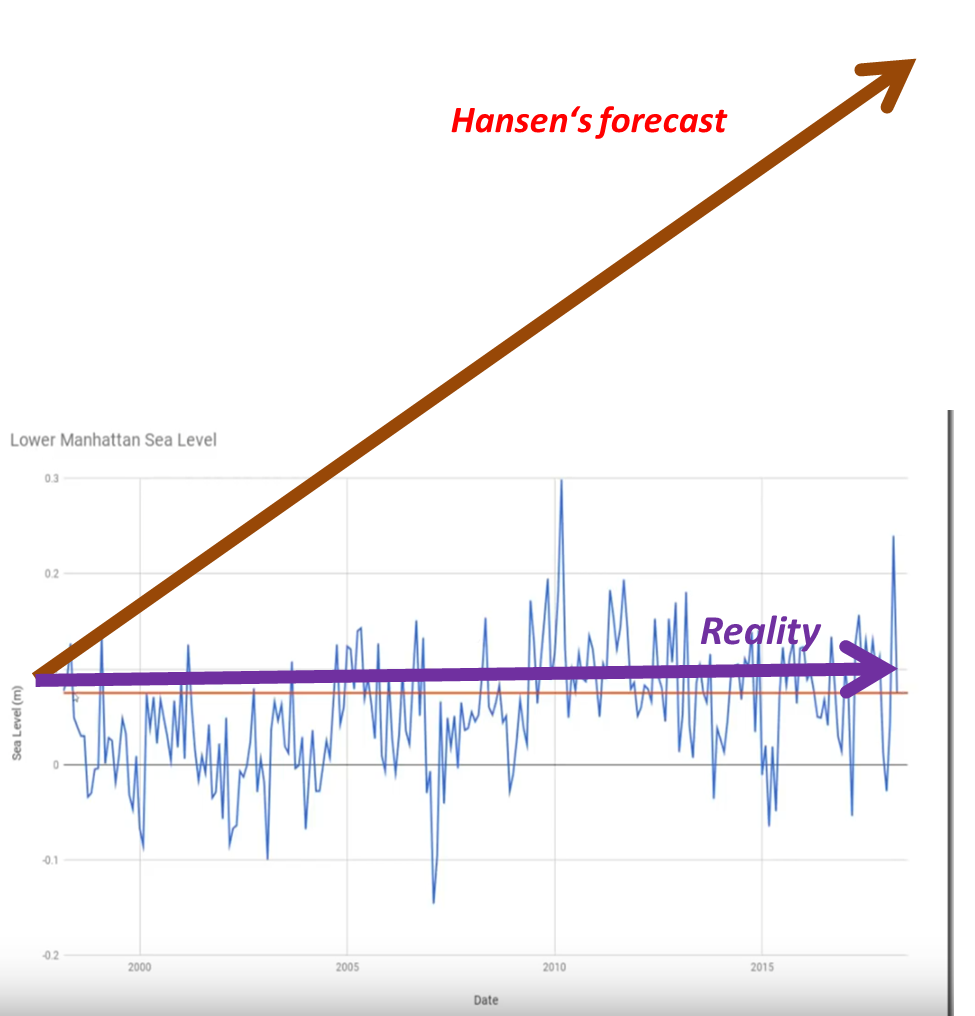
Tide gauges for Lower Manhattan show sea level has barely risen since NASA’s Dr. James Hansen warned in 1988 the area would be under water by now. Source: Cropped here.
NASA forecasts no better than fortune telling by swindling gypsies
In a nutshell, these NASA forecasts have turned out to be no better than the junk fortunes peddled by swindling gypsies of a traveling sideshow. Any meteorologist with that kind of dismal forecasting track-record would have long found himself employed as a taxi driver.
It’s time for NASA’s incompetent and fraudulent scientists to start looking for new careers and to stop wasting money and resources.
Taxpayer’s deserve far better for their hard-earned tax dollars.
via NoTricksZone
June 29, 2018 at 09:56AM