What Produces Warmth?
I live in SE Queensland. Yesterday the surface air temperature rose from a frosty 2ºC at sunrise to a balmy 22ºC in mid-afternoon. The enormous heat needed to achieve this 20ºC of warming came via radiation from the sun. Carbon dioxide in the atmosphere plays no significant part in this daily heating event – in fact it may intercept a tiny proportion of the incoming solar radiation and re-radiate it in all directions, thus keeping the daytime surface temperature a tiny bit cooler than it would have been otherwise.
At the deep Mount Isa Mine in NW Queensland, the surface temperature may average about 25ºC but it increases by about 1ºC every 50 metres of depth – rock walls are red hot in places. The enormous heat causing this comes via conduction from Earth’s internal geothermal heat plus some oxidation and heating of the sulphide ores as they come in contact with natural air containing oxygen. Carbon dioxide in the atmosphere plays no part in this heating.
There are volcanic windows open right now in Hawaii, Japan and the Galapagos revealing the vast resources of volcanic geothermal heat which is always migrating towards the cooler surface, sometimes violently.
Temperatures vary greatly over Earth’s surface, making a mockery of attempts to calculate an “average” for the globe. Air surface temperature may be minus 30ºC at the South Pole, while at the same time it can be plus 30ºC at the Equator. This enormous difference is caused by the varying intensity of solar radiation striking the surface – carbon dioxide in the atmosphere plays no significant part in creating this variance.
Surface air temperatures in big cities can be 5-10ºC hotter than surrounding rural land partly because bitumen roads, roofs, solar panels and runways heat up more than grassy or forested countryside. Mega-cities are also full of heat-producing humans, engines, trains, vehicles, air conditioners, heaters, stoves, fridges, pumps and mowers.
Urban heat also comes from the warm bodies and hot exhalations from millions of humans digesting carbon-based foods, from stored chemical energy from burning hydro-carbons (wood, lignite, coal, oil and gas) or from nuclear power. Using green energy also adds to urban heat. Wind towers and solar farms extract energy from wind and sun in the country-side and release it where most of the electricity is used, usually in cities and suburbs. Aging black rooftop solar panels convert much of the solar radiation into heat not electricity, thus adding to urban heat. Carbon dioxide in the atmosphere plays no measurable part in producing these islands of urban heat.
Longer term, the Medieval Warm Era and the Little Ice Age were natural occurrences almost certainly triggered by solar cycles which activated submarine volcanic activity along Earth’s extensive mid-ocean trenches/ridges. Human production of carbon dioxide into the atmosphere played zero part in these natural global warming and cooling episodes.
Carbon dioxide in the atmosphere varies annually with the seasons reaching a maximum in the South Hemisphere summer for two perfectly natural reasons.
First, the huge southern oceans expel carbon dioxide as the surface water warms with the return of the summer (like an opened bottle of soda water in the sun).
At the same time it is turning to winter in the large northern hemisphere landmass where deciduous trees and forests are dropping their leaves, and crop residue is accumulating on cultivated lands. As this dead plant material decomposes it recycles its CO2 to the atmosphere. And as winter grips these densely populated lands, humans are also burning wood, peat, cow dung, coal, oil and gas to keep warm, releasing even more CO2.
Then as the sun-driven seasons change, the southern oceans cool again and much of this carbon dioxide returns to the sea from whence it came. And the northern farms and forests grow faster in their summer, absorbing atmospheric carbon dioxide and solar energy to produce food and lumber.
This annual fluctuation of carbon dioxide in the atmosphere is a result, not a cause, of the seasonal temperature changes.
What happens in the seasonal weather cycle also occurs as a result of longer climate cycles of cooling and warming. The ice core records show that the changes in global temperatures precede by about 800 years any changes to the amount of carbon dioxide in the atmosphere. This is probably a result of large slow overturning in the oceans as global temperatures change in response to cycles of solar energy and earth volcanism.
Despite all of this evidence of natural changes in Earth’s temperature, man’s production of invisible life-supporting carbon dioxide is being slandered daily with words like “dirty” “black”, “polluting” “heat causing”. And those who point to dissenting evidence are called “deniers”, “shills” and worse, and gagged by intimidatory law suits and media silence.
Billions of dollars are also being spent on a propaganda storm of anti-carbon scare stories, Papal proclamations, cunning calculations, doctored data, and poignant pictures about polar bears, penguins, koalas, super-storms, social costs, floods, fires, mega-droughts, heat waves and blizzards, all supposedly impacted by rising atmospheric carbon dioxide. With just 0.04% in the atmosphere, to create such havoc carbon dioxide must be the most powerful super-gas ever imagined by the alarmists.
The green mafia is trying to lynch an innocent victim – the gas of life, carbon dioxide. They would be better served by focussing on real pollution of air, land and water caused by their own well-travelled, air-conditioned, electronic, fast-food, throw-away, tax-supported lifestyle. If they fear carbon dioxide so much, they should stop exhaling.
We need more light and less heat in the climate debate.
Further Reading:
Carbon Dioxide and the Oceans – temperature controls CO2, not the reverse:
https://carbon-sense.com/2010/12/29/forbes-co2-and-oceans/
Sun driven temperature changes cause changes in CO2:
http://notrickszone.com/2018/06/07/scientists-find-sun-driven-temperature-changes-led-co2-changes-by-1300-6500-years-in-the-ancient-past/
Atmospheric Carbon Dioxide and Marine Interaction:
http://www.bosmin.com/HenrysLaw.pdf
“Humans have zero influence on the CO atmospheric concentration – ”:
http://bosmin.com/SeaChange.pdf
Geothermal Heat from undersea volcanoes melting the Ice in West Antarctic:
https://climatechangedispatch.com/west-antarctic-glacial-melting-from-deep-earth-geological-heat-flow-not-global-warming/
Earth’s Climate is never constant – change is always with us:
https://www.thegwpf.org/content/uploads/2018/06/Berkhout.pdf
Greenpeace always makes a disaster out of it:
https://carbon-sense.com/2017/12/24/greenpeace-always-makes-a-disaster-out-of-it/
The Pope’s Misguided War On Fossil Fuels:
https://wattsupwiththat.com/2018/06/19/the-popes-misguided-war-on-fossil-fuels/
Ice cores taken in both Antarctica and Greenland show there is nothing new in climate change:
https://carbon-sense.com/2013/11/30/nothing-new-about-climate-change/
Carbon “Pollution” or Real Pollution:
https://carbon-sense.com/2012/10/15/real-pollution/
Powering the Portland Aluminium Smelter
Lessons for Victoria from South Australia
Alumina chairman, Mr Peter Day, said recently that his company was “agnostic” about the source of power to the smelter, so long as it was affordable and reliable.
“There have been many years of energy policy making that have effectively reduced energy security and reliability and substantially increased energy costs for industry.”
Victoria has plans to follow South Australia’s example by installing a grid-scale battery, but Mr Day said even Tesla’s new Hornsdale Power Reserve in South Australia (the world’s largest lithium ion battery) would not be sufficient to run Portland.
“If it was fully charged and available, it could run Portland for around 20 minutes,” he said.
Renewables can’t power aluminium smelter:
https://www.afr.com/business/energy/renewables-alone-cant-power-smelter-says-alumina-20180524-h10hw6
A reader commented:
“At 0955 on 23/6/18, South Australia’s electricity demand and generation was:
- Demand 1551 MW
- Generation in SA 853 MW
- Wind and other 0 MW (this is not a misprint, it was zero)
- Import from Victoria 717 MW
“The data above is nothing unusual and was sourced from AEMO’s data dashboard. Just for fun, I monitor it every day and believe me it is not a pretty sight.”
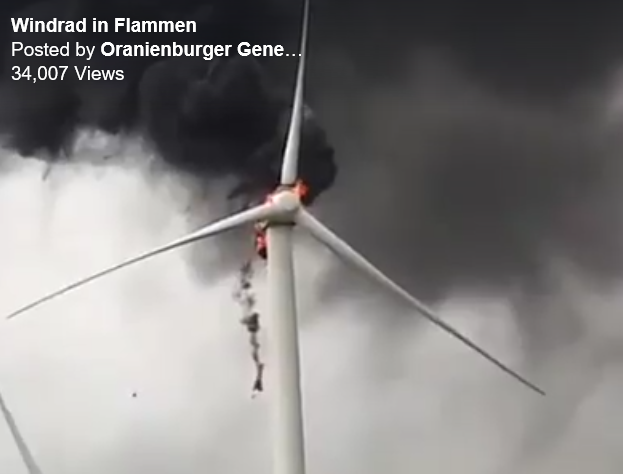
But Wind Turbines are Good at Killing Birds
https://www.youtube.com/watch?v=5lb6VeMaXy8

Griffon vultures, Spain
PDF version of this post: https://carbon-sense.com/wp-content/uploads/2018/06/lynching-bystander.pdf [PDF, 1.4 MB]
via The Carbon Sense Coalition
https://ift.tt/2lxr1vL
June 23, 2018 at 03:13AM