
Guest “EXCELLENT!” by David Middleton
U.S. Carbon Emissions Surged in 2018 Even as Coal Plants Closed
By Brad Plumer
Jan. 8, 2019
WASHINGTON — America’s carbon dioxide emissions rose by 3.4 percent in 2018, the biggest increase in eight years, according to a preliminary estimate published Tuesday.
[…]
Under the Paris climate agreement, the United States vowed to cut emissions 26 to 28 percent below 2005 levels by 2025. The Rhodium Group report warns that this target now looks nearly unattainable…
[…]
No schist Sherlock. The United States didn’t vow to cut anything. Barack Hussein Obama unilaterally vowed “to cut emissions 26 to 28 percent below 2005 levels by 2025.” President Trump submitted our withdrawal notice… So Obama’s vow was already unattainable before U.S. carbon emissions spiked last year.
Whey did carbon emissions increase in 2018?
- A booming economy. GDP growth during the first 2 years of the Trump administration has been about 50% higher than that of Obama’s eight-year maladministration.
- Our manufacturing sector is booming.
- A booming economy drove up trucking and air travel.
- Electricity demand increases and most of the increasing was powered by natural gas because renewables couldn’t even keep up with no growth.

Natural Gas Kicked @$$
From the Rhodium Group:
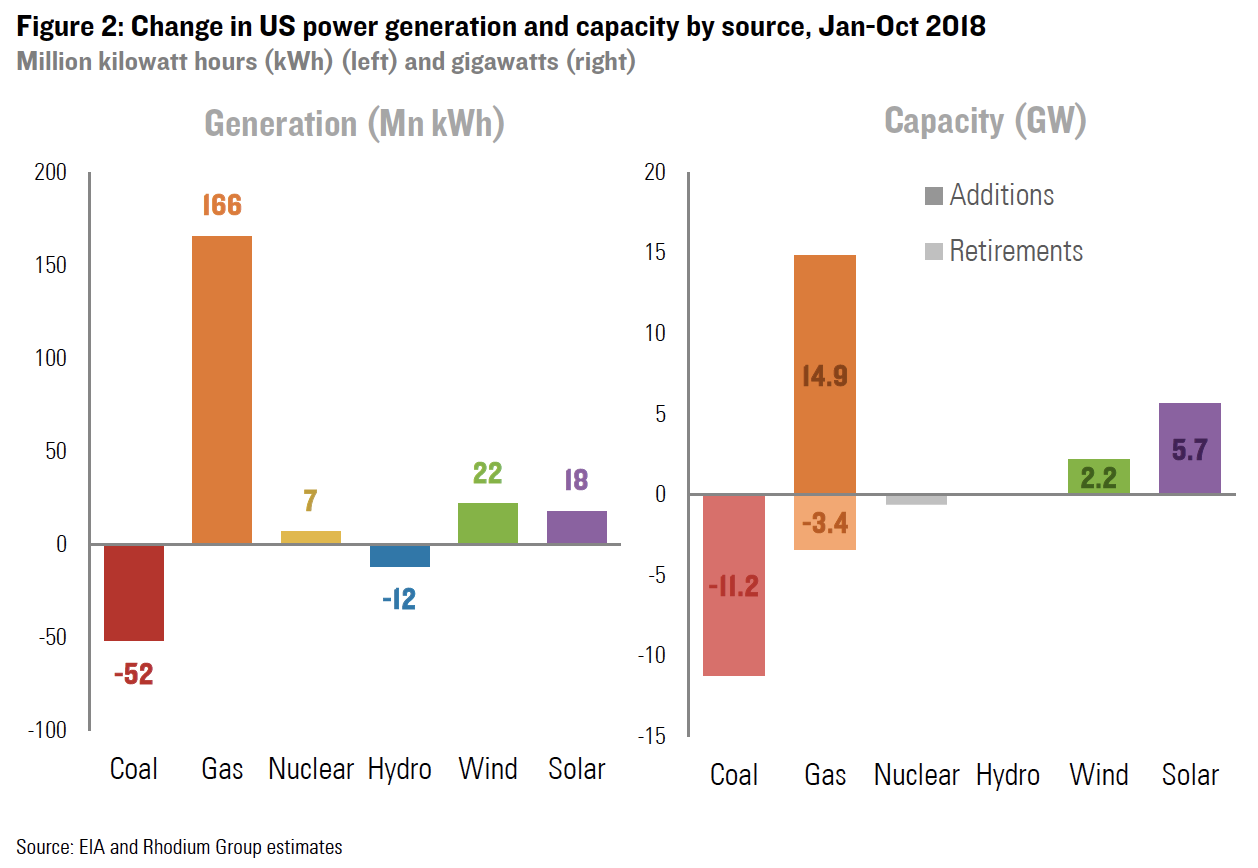
Record Coal Closures, But Gas Picks Up the Slack
As of the end of October, 11.2 gigawatts (GW) of coal-fired power generation capacity had closed in the US (Figure 2). With another 2.5 GW of capacity scheduled for retirement by the end of December, 2018 could end up being the biggest coal plant closure year on record.
Coal-fired power generation was down sharply last year as well — more than in 2017 though not nearly as much as in 2012, 2015 and 2016. Unlike those years, where electricity demand was either flat or declining, US power consumption increased meaningfully in 2018. Natural gas not only replaced most of the lost coal generation but also fed the vast majority of the load growth last year. Between January and October, US power companies added a greater share of gas capacity than the share of retired coal capacity, and twice as much gas went online as combined wind and solar capacity additions (including distributed solar) during that period. Natural gas-fired generation increased by 166 million kWh during the first ten months of the year. That’s three times the decline in coal generation and four times the combined growth of wind and solar.
Keep on Truckin’
From the Rhodium Group:
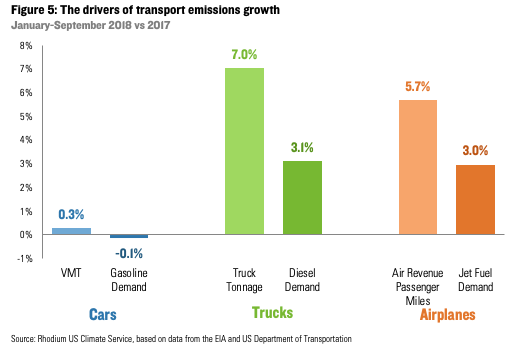
The More Stubborn Parts of Transportation
The transportation sector retained its title as the largest source of CO2 emissions in the US for the third year running (Figure 4). During the first nine months of the year, gasoline demand declined by 0.1% as modest efficiency gains offset a minor increase in vehicle miles traveled (Figure 5). But robust growth in demand for both trucking and air travel increased demand for diesel and jet fuel by 3.1% and 3.0%, respectively. This highlights the challenges in decarbonizing the transportation sector beyond light-duty vehicles. Here we see efficiency improvements and electrification beginning to make a dent, albeit not nearly a big enough one to meet medium- and long-term US emissions targets.
Preliminary fourth quarter data suggests an accelerated decline in gasoline demand, an uptick in diesel demand and moderation in jet fuel demand relative to the first three quarters of the year. All told, we estimate that transportation emissions grew by 1% in 2018, roughly the same as the 2017 growth rate.
A Cold Winter and Hot Industrial Sector
From the Rhodium Group:
The Forgotten Sectors
The largest emissions growth in 2018 occurred in the two sectors most often ignored in clean energy and climate policymaking: buildings and industry. We estimate that direct emissions from residential and commercial buildings (from sources such as fuel oil, diesel and natural gas combusted on site for heating and cooking) increased by 10% in 2018 to their highest level since 2004. Part of this was due to a colder winter — the number of heating degree days (HDDs) across the US increased by 15% during the first quarter of 2018 relative to the same period the year prior.
[…]
While buildings have begun to attract some creative policy thinking, the industrial sector is still almost entirely ignored. At the state and federal level few good strategies have been implemented to begin decoupling production from emissions. Our preliminary estimates suggest the industrial sector posted the largest emissions gains in 2018 at 55 million metric tons. That was due mostly to growth in industrial activity. The value of shipments across all manufacturing industries rose 7.3% during the first nine months of the year, compared to 4.5% during the same period the year before. The Federal Reserve’s industrial production index for manufacturing was up 2.5% year-on-year between January and November 2018, compared with 1.4% during the same period the year before.
[…]

The fact that this report could be construed as bad news by Warmunists is proof that they have gone…
Carbon Emissions vs. Carbon Dioxide Emissions
Carbon dioxide is the dominant anthropogenic species of carbon emissions. However, it is part of the carbon cycle. Carbon compound emissions would probably be most accurate. But carbon emissions requires less keystrokes, so I’m OK with it.

via Watts Up With That?
January 8, 2019 at 05:41PM
