
Contributed by Robert Lyman © 2019
Robert Lyman is an Ottawa energy policy consultant, a former public servant of 27 years and a diplomat for 10 years prior.
The Grantham … Continue reading
via Friends of Science Calgary
March 24, 2019 at 11:54AM
Contributed by Robert Lyman © 2019
Robert Lyman is an Ottawa energy policy consultant, a former public servant of 27 years and a diplomat for 10 years prior.
The Grantham … Continue reading
via Friends of Science Calgary
March 24, 2019 at 11:54AM
Schneefan at German skeptic site wobleibtdieerderwaermung here writes how renowned German news weekly DER SPIEGEL appears to have made up another story, this time involving a nonsensical climate alarm. The embattled SPIEGEL this time selected a small area at the edge of the Arctic (Bering Sea/Bering Strait), which is usually not covered by more than half the ice anyway, and “drew completely absurd and inaccurate conclusions from it”.
Faked story about rural America
We will recall how not long ago SPIEGEL sent out journalist Claas Relotius to do a story about rural America, who in turn made up everything in his report in order to fit a grotesque caricature of conservative America.
Latest: fake story about disappeared sea ice
Now it appears SPIEGEL has once ignored the real facts about the Arctic and instead made up a story to fit the alarmist global warming narrative. SPIEGEL wrote:
The Bering Strait is a narrow strait that separates Russia from Alaska. Normally it is covered with ice in spring – not so this spring, as images from the European Earth observation satellite “Sentinel 1” on 7 March show. The approximately 80 kilometres connecting the Pacific and Arctic Oceans are almost ice-free…
Indeed the spread of sea ice has reached a new record low this March, according to ESA.”
Reality: Bering Strait “completely covered with sea ice”
Yet, a review of the March 7, 2019, date that is cited in the SPIEGEL article shows that the Bering Strait was in fact completely covered with sea ice:
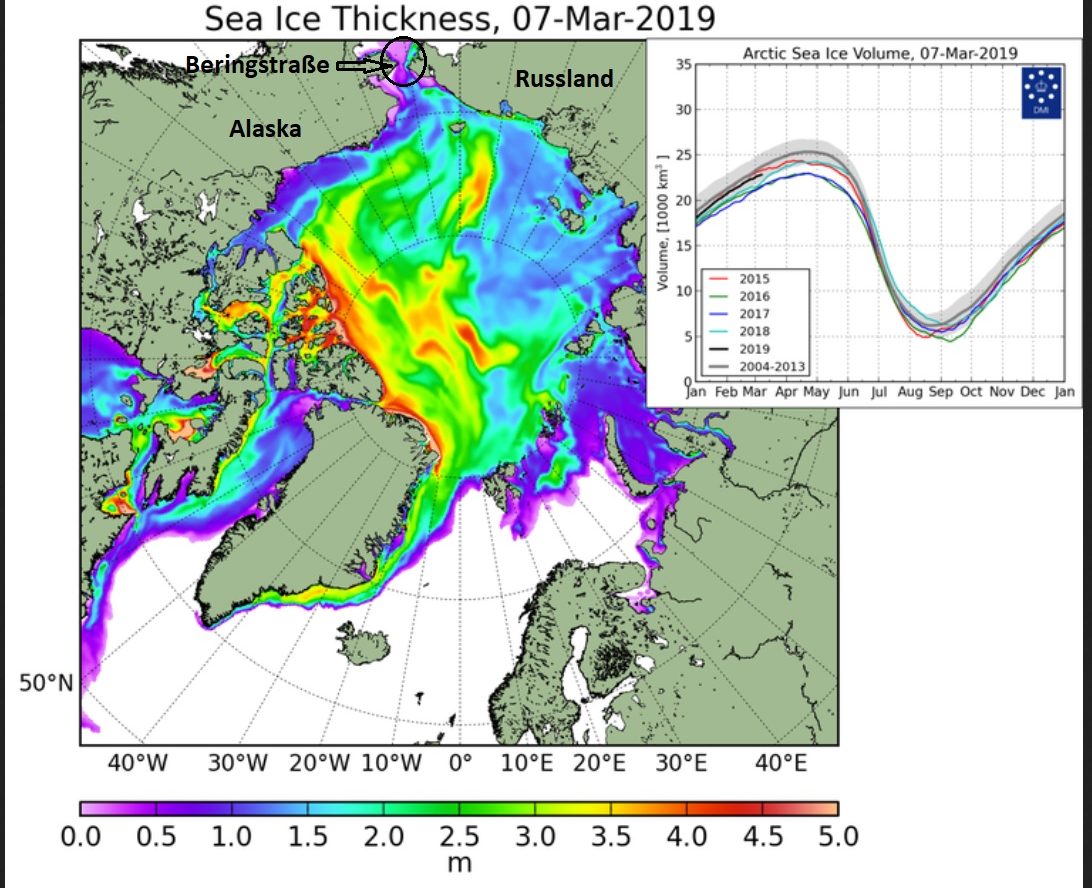
On March 7, 2019, the Bering Strait was completely covered with sea ice that was between 0.5 and 1.5 m thick. The SPIEGEL falsehood of an “almost ice-free Bering Strait” at the beginning of March 2019 has been exposed. Source: DMI Arctic Sea Ice Thickness and Volume
The “almost ice-free Bering Strait” is once again an invention of a SPIEGEL editor. The ice was also there back in February, too:

The NSIDC chart above shows the average extent of the sea ice areas (white) in the Arctic in February 2019. The pink lines show the extent of the sea ice areas in the globally accepted WMO climate average 1981-2010 since 2015. The Arctic “Bering Sea” (top left) was covered with ice in February 2019 about half of the average area. The assertion in the SPIEGEL article “The approximately 80 kilometers connecting the Pacific and the Arctic Oceans are almost ice-free” is false, as the Bering Strait (strait between Russia and Alaska) is completely covered with ice. Source: NSIDC Sea Ice Index
And nothing has changed as of March, 2019, as a look at sea ice thickness shows:
As in February 2019, the chart above shows that the Bering Strait is completely covered with sea ice between 0.5 and 1.5 m thick on March 20, 2019. SPIEGEL lie of an “almost ice-free” Bering Strait at the beginning of March, 2019, has been exposed. Source: DMI Arctic Sea Ice Thickness and Volume
When it comes to weather and climate, it is not the sea ice cover of a small marginal region that is of importance, but rather the entire sea ice area and the sea ice volume of the Arctic – and Antarctica – as a whole. The sea ice areas of the Arctic (extent) are currently at the highest level of the last five years: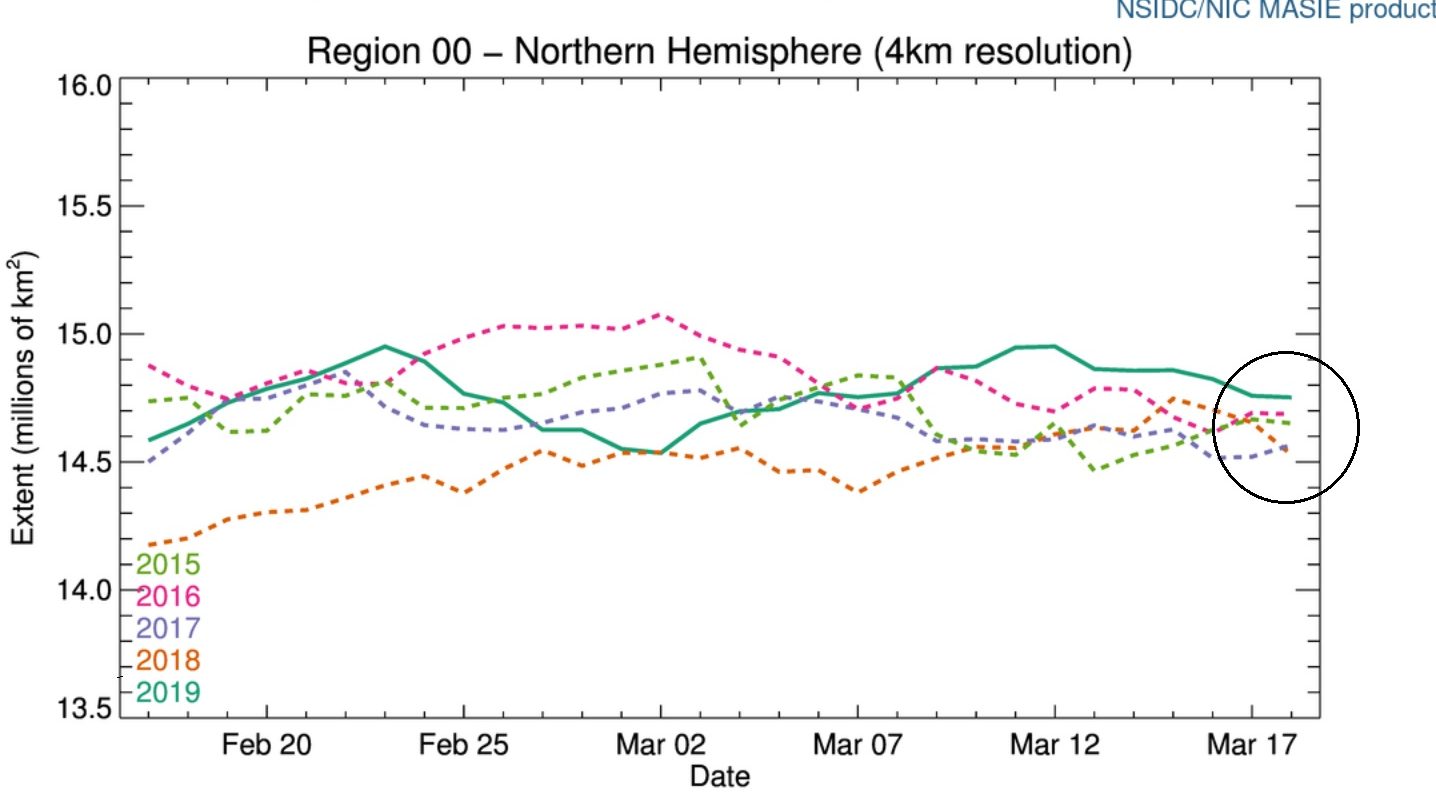
Chart: NSIDC
The Arctic sea ice VOLUME, i.e. the mass of sea ice, is also larger than in recent years and remains within the multi-year average (grey area):

Source: DMI Arctic Sea Ice Thickness and Volume
Schneefan concludes: “That is the measured reality, everything else is FAKE-NEWS (‘…false reports spread with manipulative intent’).”
Entire original German article here.
via NoTricksZone
March 24, 2019 at 11:11AM
 In February the media breathlessly told us that Bering Sea ice has melted away, and thus Arctic ice is doomed. Now we see that reports of the demise were premature. More surprising than the early retreat, Bering ice roared back in the last two weeks, and continues to grow even after the overall NH ice extent peaked
Two Weeks of Growing Bering Ice: The above image shows the last two weeks of dramatic ice growth in Bering with only minor melting in Okhotsk. Bering Sea on the right added 250k km2 and has effectively sealed off Chukchi inside the Arctic. Meanwhile on the left Okhotsk ice seesawed, ending up 150k km2 lower, but still at 88% of 2019 maximum.
 The graph below shows March progress in ice extent peaking and beginning the melt season.As noted before, the month started with a sharp increase nearly reaching average and 15M km2. After March 12, ice declined steadily as is normal after mid-March. 2019 extent is running lower than the 12 year average, but slightly higher than other recent years. SII is showing about 100k km2 less ice than MASIE.

The table below shows the distribution of ice in the various Arctic basins.
| Region | 2019082 | Day 082 Average |
2019-Ave. | 2018082 | 2019-2018 |
| (0) Northern_Hemisphere | 14600645 | 14891081 | -290436 | 14511954 | 88692 |
| (1) Beaufort_Sea | 1070291 | 1070115 | 176 | 1070445 | -154 |
| (2) Chukchi_Sea | 966006 | 965595 | 411 | 966006 | 0 |
| (3) East_Siberian_Sea | 1087137 | 1086844 | 293 | 1087137 | 0 |
| (4) Laptev_Sea | 897845 | 897552 | 293 | 897845 | 0 |
| (5) Kara_Sea | 926462 | 917591 | 8871 | 934807 | -8344 |
| (6) Barents_Sea | 681050 | 653698 | 27352 | 720725 | -39675 |
| (7) Greenland_Sea | 552178 | 642867 | -90689 | 539109 | 13069 |
| (8) Baffin_Bay_Gulf_of_St._Lawrence | 1431122 | 1509559 | -78437 | 1346761 | 84361 |
| (9) Canadian_Archipelago | 853337 | 852881 | 456 | 853109 | 229 |
| (10) Hudson_Bay | 1260903 | 1255967 | 4937 | 1260838 | 66 |
| (11) Central_Arctic | 3227734 | 3227309 | 426 | 3158495 | 69240 |
| (12) Bering_Sea | 446151 | 773234 | -327083 | 345861 | 100291 |
| (13) Baltic_Sea | 41886 | 87497 | -45611 | 135848 | -93962 |
| (14) Sea_of_Okhotsk | 1150521 | 933366 | 217155 | 1183119 | -32598 |
The table shows how 2019 is 290k km2 or 2% below the 12-year average. Most basins are matching average extent, including Barents Sea edging slightly ahead of average. Greenland Sea and Baffin Bay are below average. Despite recent gains, Bering ice is 327k km2 in deficit to average, nearly the difference in overall NH extent. Meanwhile Okhotsk is 217k km2 surplus to average, partially offsetting Bering.

via Science Matters
March 24, 2019 at 10:58AM
Orange County, Florida used to be one of the largest citrus producers in the state.
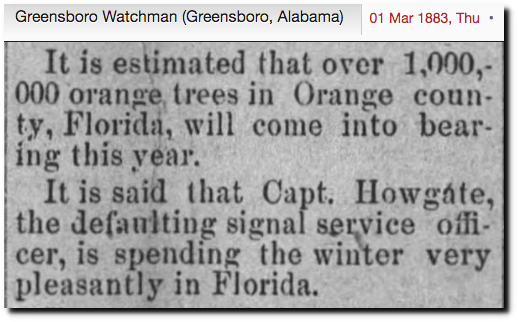
01 Mar 1883, 2 – Greensboro Watchman at Newspapers.com
But it got too cold there, and the citrus industry is nearly gone.
Today there are so few citrus groves left in Orange County they could fit neatly inside a single modern housing development such as east Orlando’s Avalon Park.
Orange County at one time was one of the top five producers of citrus ….. a freeze in the 1950s had wiped out most of the tangerine production ….. At just 2,300 acres today, the amount of ground covered in trees is down 50 percent in the last 10 years and is just a tiny fraction of the some 50,000 acres of groves in Orange County before the freezes of the 1980s. ….
That was around the time when the title “citrus grower” became a synonym for “real estate developer.”
“We had no choice,” Chicone recalled. “The first freeze came [in 1983] and most everybody replanted. It took a lot of money to clear the land and buy new trees and start producing. We all did that one time and then the second freeze came.”
That was in 1985. Then another severe freeze in 1989, which wiped out much of whatever had managed to survive.
Kassab: The end of oranges in Orange County – Orlando Sentinel
via The Deplorable Climate Science Blog
March 24, 2019 at 09:40AM
