
Could a transition in paleoclimate reconstruction be underway? More and more, scientists aren’t hiding statements or graphical depictions of the lack of modern warming or the much-warmer Holocene past.

A compilation of 35 papers from across the globe indicate that modern climate is not unusual, remarkable or unprecedented, and that large regions of the Earth were as warm or warmer than now when CO2 concentrations were much lower (260 to 350 ppm).
This development continues apace with the trends from the last two years, when 253 non-hockey stick papers were published.
Tonno et al., 2019
“In North Europe, changes in early Holocene climate were rather intense, starting with low temperatures at the beginning of the period, followed by gradual warming, interrupted periodically by short cooling periods (Antonsson and Seppa¨ 2007). During the Holocene Thermal Maximum (HTM), the period from 8.0 to 4.0 cal ka BP, average temperatures in Northern Europe were approximately 2.5–3.5 C higher than today (Antonsson and Seppa¨ 2007; Heikkila¨ and Seppa¨ 2010; Ilvonen et al. 2016).”

Pitulko et al., 2019
“Our data show that from c. 10 600 BP, Zhokhov Island was situated on the margin of the shrinking Arctic coast (Anisimov et al. 2009); this is supported by the presence of a large quantity of driftwood that washed ashore at the Zhokhov site. The environmental situation was relatively favourable for human occupation: the climate was [5-6°C] warmer than today, and Zhokhov Island was covered by an Arctic tundra comprising sedge grass, shrubs and dwarf birch (Makeyev et al. 2003).”


Salvatteci et al., 2019
“[O]tolith δ18O data from Peruvian catfish (Galeichthys peruvianus) excavated from archeological sites in northern Peru suggest SST ~4 °C warmer than present‐day SST (Andrus et al., 2002).”

Rohling et al., 2019

Røthe et al., 2019
“Our findings do not provide any confirmation that the glacier Sørfonna melted entirely away during the Holocene Thermal Maximum (HTM). Bjune et al. (2005) suggest summer temperatures were 1.5–2 °C warmer than present during this period. Combined with the evidence from the glaciers Nordfonna and Hardangerjøkulen, it is, however, likely that the glacier Sørfonnawas also significantly smaller than at present during this period. … Since 1650 cal. a BP, we infer that the glacier was larger than the 2002 CE glacier extent until 1910 CE when a GLOF [glacier outburst flood] occurred. Svartenutbreen has been retreating since 1910 CE, which led to the ice damming of the two historical GLOFs [glacier outburst floods] in the 1980s and 2002 CE separated by a glacier advance in the 1990s CE.”

Liu et al., 2019
“The modern vegetation around Tianchi Crater Lake is categorized as temperate mixed conifer-broad-leaved forest … The area experiences a typical cold temperate monsoon climatic regime with long cold winters and short cool summers. The [modern] annual average air temperature is 0–0.5 °C … The PFT-MAT-based reconstructed Pann record for Tianchi Crater Lake has a similar trend of variation to that of the pollen percentage diagram. The ranges of Pann [annual precipitation] and Tann [annual mean temperature] are 268–881 mm and 1.7–10.5°C, respectively [for the Holocene]. …[V]ariations in Tann exhibit […] a marked rise from the beginning of the early Holocene and a peak at 9000–8000 cal yr BP.”

Steinman et al., 2019
“The early Holocene d18O [hydroclimate] maximum in the Castor Lake record at 9630 (9110-10,100) yr BP is likely in part a result of higher summer insolation, which produced higher temperatures and greater evaporation during the warm season. Additionally, atmospheric circulation in the early Holocene was substantially different from the modern configuration (Bartlein et al., 2014), and precipitation amounts were likely lower, due to the presence of the residual Laurentide and Cordilleran Ice Sheets (Dyke, 2004), which affected air mass trajectories and the seasonal distribution and amount of precipitation on a hemispheric scale. … A chironomid based climate reconstruction from Windy Lake, south-central British Columbia, supports the assertion that greater summer insolation produced warmer summer temperatures at this time (Chase et al., 2008).”

Zhang et al., 2019
“Studies of solar activity and cosmic radiation indicate that solar activity is the main factor driving climate change on decadal-to centennial scales (Stuiver and Braziunas, 1993; Xu et al., 2014; Yu and Ito, 1999; Zhao et al., 2010). In addition, solar activity is well correlated with global surface temperature (Bond et al., 2001; Usoskin et al., 2003). Changes in the production rates of two common cosmic radionuclides (∆14C and 10Be), which are preserved in ice cores and tree rings, suggest that periodic fluctuations in solar activity on decadal-to-centennial scales directly affect the cosmic ray flux (Abreu et al., 2013; Masarik and Beer, 1999; Steinhilber et al., 2012). Kirkby (2007) summarized evidence for a close relationship between temperature change and solar activity during the last millennium, finding that cosmic radiation flux was weak and solar activity was strong during the MWP; whereas, the opposite conditions occurred during the LIA. Therefore, the cosmic ray flux can be regarded as a proxy for solar activity and that it can be used to assess the relationship between climate change and solar activity. … Several notable cold periods, with lower Quercus frequencies, occurred at approximately 1200 AD, 1410 AD, 1580 AD, 1770 AD and 1870 AD. These centennial-scale cold periods basically correspond to major minima in solar activity, suggesting that variations in solar activity may have been an important driver of climate and vegetation change in the study area during the last millennium.”

Lozhkin et al., 2019
“Mixed Larix-Betula forest was established at the Tanon site by ∼6600 14C BP (∼7500 cal BP). This forest included Betula platyphylla, a species common in moderate zones of the Russian Far East (e.g., B. platyphylla-Larix forests of central Kamchatka). The importance of Betula in the Middle Holocene assemblage is unusual, as tree Betula is not a common element in the modern coastal forest. The abundance of B. platyphylla macrofossils particularly suggests warmer than present summers and an extended growing period. This inference is supported by a regional climate model that indicates a narrow coastal region where the growing season was longer and summer temperatures were 2-4 °C warmer than today. Variations in Betula pollen percentages at other sites in northern Priokhot’ye are suggestive that this Middle Holocene forest was widespread along the coast.”

Novenko et al., 2019
“[D]uring the Holocene Thermal Maximum when the mean annual temperatures were 2°С higher than those of the present day [6,9,10,11]. Roughly 5.7–5.5 ka BP, the Holocene Thermal Maximum was followed by gradual climatic cooling that included several warming and cooling phases with temperature fluctuations ranging between 2 and 3°С. …The CFSNBR [Central Forest State Natural Biosphere Reserve] is situated roughly 360 km northwest of Moscow (the Tver region, 56º35’ N, 32º55’ E) in an ecological zone transitioning from taiga to broadleaf forests. The vegetation of the CFSNBR is primary southern taiga forests, and it has been undisturbed by any human activities for at least 86 years. The climate of the study area is temperate and moderately continental with a mean annual temperature of 4.1°C and annual precipitation of roughly 700 mm.”

Rey et al., 2019
“Our results imply that mixed Fagus sylvatica forests with Abies alba and Quercus may re‐expand rapidly in these areas, if climate conditions will remain within the range of the mid‐Holocene climatic variability (with summers c. +1–2°C warmer than today). … [T]he rise and fall of early farming societies was likely dependent on climate. Favourable climatic conditions (i.e. warm and dry summers) probably led to an increase in agricultural yields, the expansion of farming activities and resulting forest openings, whereas unfavourable climatic conditions (i.e. cold and wet summers) likely caused crop failures, abandonment of agricultural areas and forest succession. A better understanding of the environmental and societal factors controlling coeveal land-use dynamics as shown in this study would require new climate proxy data (e.g. temperature reconstruction from well dated and complete Holocene tree ring series). On the basis of our results and considering the ongoing spread of temperate forests in lowland Central Europe, we conclude that the existing beech forest ecosystems are resilient to anthropogenic disturbances under a changing climate.”

Eda et al., 2019
“Recent taxonomic composition and faunal distribution patterns support recognition of three biogeographic regions in Asia, Palaearctic (north), Indomalayan (south), and a transition zone between the two (Hoffmann 2001). In the division, the Yangtze River delta is located at the boundary of the Indomalayan region and transition zone. Pollen records suggest that, middle Holocene temperatures were ca. 2–4 °C warmer than today in the middle Yangtze River delta (Yi et al. 2003). Peters et al. (2016) indicated that the middle Yangtze River basin would delimit the northern most boundary for required habitat of (sub-) tropical red junglefowl during the Holocene thermal optimum. Furthermore, Xiang et al. (2014) reported that the wild distribution area of red junglefowl extended to northern China in the early Holocene, and domestic chicken farming began in the region.”

Lee et al., 2019


Caballero et al., 2019
“Diatom-based transfer functions for salinity, precipitation and temperature were developed using a training set that included data from 40 sites along central Mexico. … Maximum last glacial cooling of ∼5°C is reconstructed, a relatively wet deglacial and a warmer (+3.5°C) early Holocene. … The early Holocene marked a change towards high lake salinities and the highest positive temperature anomalies (+3.5°C) during a peak in summer insolation.”
Collins et al., 2019
“Over the past 2300 yrs, SST values range between 14.3°C and 12.2°C (Fig. 4a), and hence most of the record is warmer than today. The earlier half of the record is relatively warm and stable and displays a gradual warming from 13.2°C at 2300 cal yrs BP to 14°C at 1200 cal yrs BP. The largest feature of the record is the cooling transition from 14°C to 12.5°C between 1100 and 600 cal yrs BP. This is followed by warming to 13.5°C at 300 cal yrs BP and then cooling to 12.5°C at present day. Multi-centennial variability is more clearly highlighted in the filtered record and is most pronounced over the last 1200 years. The record exhibits relatively warm conditions during the periods 1200 – 950 cal yrs BP and 500 – 200 cal yrs BP and relatively cool conditions during the periods 950 – 500 cal yrs BP and 200 – present. … Southern Ocean cooling is expected to have further enhanced sea ice cover in the Southern Ocean (Park and Latif, 2008; Zhang et al., 2017a). This is in accordance with two records displaying increased sea ice in the western Ross Sea at a similar timing (between 1250 and 650 cal yrs BP) to the cooling (Mezgec et al., 2017). Late Holocene sea-ice increases are also observed to the west of the Ross Sea (Denis et al., 2010), to the west of the West Antarctic Peninsula (Etourneau et al., 2013) and in the Eastern Ross Sea (Mayewski et al., 2013). Associated ice-albedo and ice-insulation feedbacks (Renssen et al., 2005; Varma et al., 2012) may have contributed to the rapidity of the cooling and sea-ice expansion. … Solar variability would be a potential driver of the changes in ENSO and SAM coupling. Increased (decreased) TSI has been shown to promote La-Niñalike (El-Niño-like) conditions by enhancement of the trade winds (Mann et al., 2005). Similarly, the SHW are sensitive to the 11yr solar cycle (Haigh et al., 2005) and solar variability on centennial timescales (Varma et al., 2011) and thus solar variability might be expected to exert an influence on the SAM. Therefore, it is plausible that solar variability may have controlled the phasing of ENSO and the SAM, and this remains an interesting avenue for further climate modeling research.”

Lohmann et al., 2019

Yuan et al., 2019
“During the early Holocene (10.0–6.0 ka), the modern-type circulation system was not established, which resulted in strong water column stratification; and the higher sea surface temperature (SST) might be associated with the Holocene Thermal Maximum (HTM). The interval of 6.0 to 1.0/2.0 ka displayed a weaker stratification caused by the intrusion of the Yellow Sea Warm Current (YSWC) and the initiation of the circulation system. A decreasing SST trend was related to the formation of the cold eddy generated by the circulation system in the ECS. During 1.0/2.0 to 0 ka, temperatures were characterized by much weaker stratification and an abrupt decrease of SST caused by the enhanced circulation system and stronger cold eddy, respectively.”

Marret et al., 2019
“The studied region is the only coastal region in Russia to have subtropical landscapes as well as humid to semi-arid landscapes (Petrooshina, 2003). Winter temperatures average 3–5°C in winter up to 23–24°C in summer. … A possible maximum of warm conditions may have occurred between 3.0 and 2.5 cal. ka BP, as highlighted by the occurrence of O. israelianum. This species has not been seen in modern sediments from the Black Sea nor the Caspian Sea and mainly occurs in waters where winter SSTs are above 14.3°C and summer SSTs are more than 24.2° C … Establishment of present-day conditions may have happened within the last 1500 years, but the low-resolution sampling at the top of the core prevents us to exactly pinpoint this change. However, our dinocyst assemblage indicates cooler conditions [today] with the decrease of S. mirabilis.”

Ortega et al., 2019
“Highly variable SSTs in Tongoy Bay occurred during the last 2000 years (Figure 7c), and possibly earlier, in agreement with variable upwelling since ~3000 yr ago suggested by variable faunal assemblages (32°45’S) (Marchant et al, 1999). … Observed standardized annual precipitation and the 10-year running average at La Serena show a general decreasing trend (Figure 8a) reflecting the persistent aridification affecting the semi-arid coast of Chile. The linear trend over the whole observed period (1869–2016 CE) indicates that La Serena has had a 4% decrease in precipitation per decade, as previously documented by Schulz et al. (2011) and Quintana and Aceituno (2012). A similar calculation for CMIP5 simulations (1850-2005, historical simulations) indicates no significant trend over the 20th century. This difference between observations and simulations suggests that most of the observed trend is due to natural variability instead of a forced response to anthropogenic forcing.”

Gebbie and Huybers, 2019
“The ongoing deep Pacific is cooling, which revises Earth’s overall heat budget since 1750 downward by 35%. … In the deep Pacific, we find basin-wide cooling ranging from 0.02° to 0.08°C at depths between 1600 and 2800 m that is also statistically significant. The basic pattern of Atlantic warming and deep-Pacific cooling diagnosed from the observations is consistent with our model results, although the observations indicate stronger cooling trends in the Pacific. …. At depths below 2000 m, the Atlantic warms at an average rate of 0.1°C over the past century, whereas the deep Pacific cools by 0.02°C over the past century. … These basin-wide average trends are used to relax the assumption of globally uniform changes in surface conditions and to constrain regional temperature histories for 14 distinct regions over the Common Era by a control theory method. The result, referred to as OPT-0015, fits the observed vertical structure of Pacific cooling and Atlantic warming. Global surface changes still explain the basic Atlantic-Pacific difference in OPT-0015, but greater Southern Ocean cooling between 600 and 1600 CE leads to greater rates of cooling in the deep Pacific over recent centuries.”


Image Source: Supplemental Data (Gebbie and Huybers, 2019)
Lasher and Axford, 2019
“More positive δ18O values are found between 900 and 1400 CE, indicating a period of warmth in South Greenland superimposed on late Holocene insolation-forced Neoglacial cooling, and thus not supporting a positive NAO anomaly during the MCA. Highly variable δ18O values record an unstable climate at the end of the MCA, preceding Norse abandonment of Greenland. The spatial pattern of paleoclimate in this region supports proposals that North Atlantic subpolar ocean currents modulated South Greenland’s climate over the past 3000 yr, particularly during the MCA. Terrestrial climate in the Labrador Sea and Baffin Bay regions may be spatially heterogeneous on centennial time scales due in part to the influence of the subpolar gyre.”
Zhang et al., 2019
“In core 31003, the SST record shows a distinctly anti-phase relationship with that of core 38002 over the last millennium. For instance, from the MWP to LIA, SST values increased from ∼17.0 ± 0.3°C to ∼19.1 ± 0.6°C in the northern core 38002 but decreased from ∼24.3 ± 0.4°C to ∼23.5 ± 0.3°C in the southern coastal core 31003. Since ∼1850 AD, the SST record in core 31003 elevated within the range of 24.3 ± 0.4°C, similar to values during the MWP, but decreased gradually to ∼18.0°C in core 38002, in line with the SST trends at two additional locations from the YSWC [Yellow Sea Warm Current] pathway as reported by He et al. (2014).”


Araźny et al., 2019
“Air temperature in 1899–1914 during three expeditions was 1.8–4.6 °C lower than the modern period in winter (Oct–Apr). However, during the 1930/31 expedition it was 4.6 °C warmer than the years 1981–2010. Our results relate to what has been called the ‘1930s warming’, referred to by various authors in the literature as the ETCW or the ETCAW. … In individual months, the highest negative anomalies were identified in Calm Bay (hereafter CB) in January 1914 (− 7.4 °C) and in February 1900 (− 6.8 °C). In contrast, during the 1930/31 expedition, it was 4.6 °C warmer than the present day in CB [Calm Bay]. Such a high thermal anomaly was influenced by a warm autumn and winter, especially February 1931, when the average monthly temperature was 10.7 °C higher than in the modern period.”


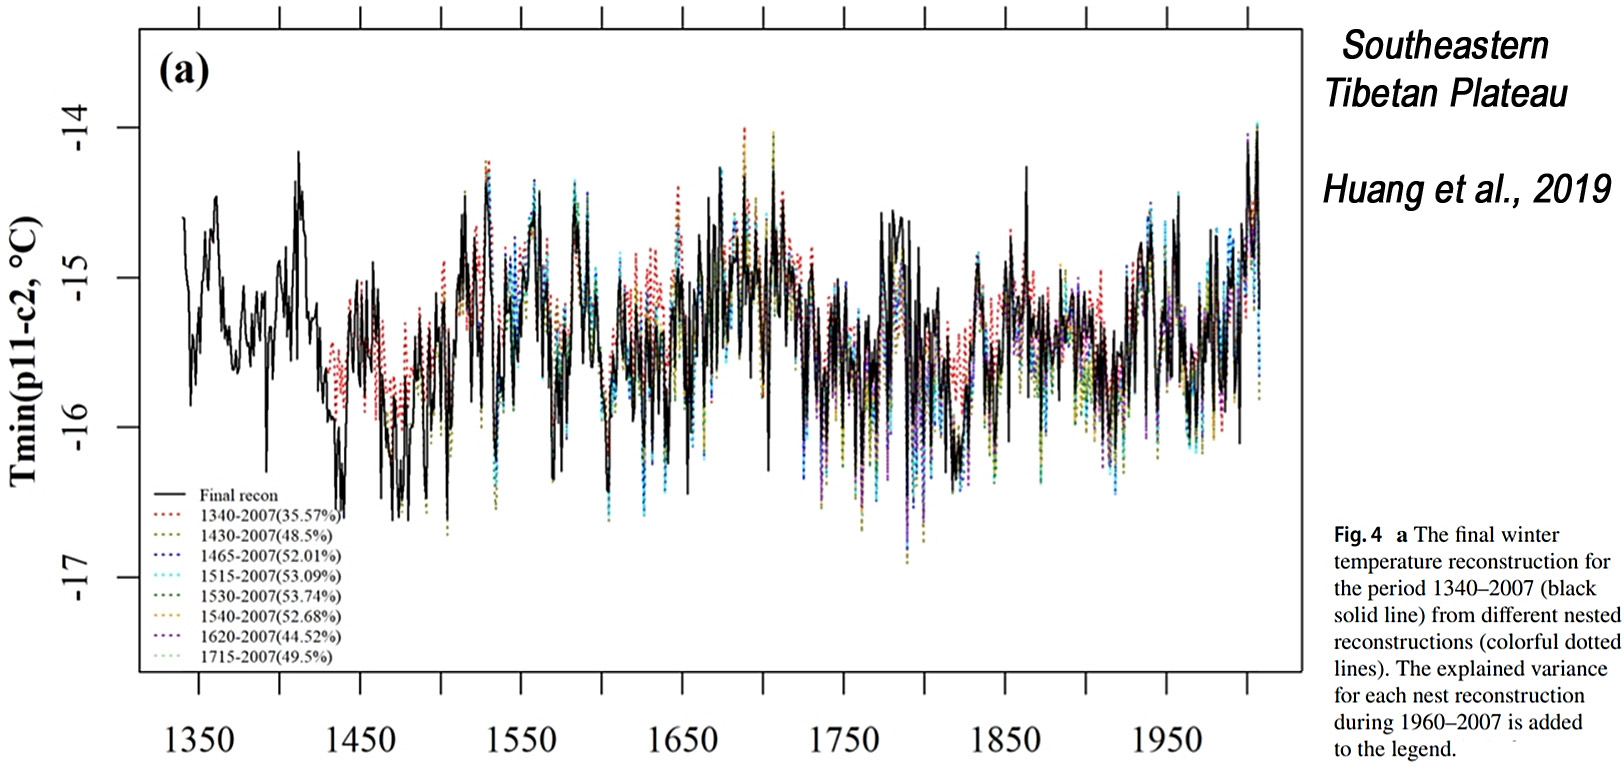
Huang et al., 2019
“The temperature effect of the Zhada δ18OTR series is further verified by consistency with nearby ice-core δ18O variability.”

Huang et al., 2019
“Climatic change is exhibiting significant effects on the ecosystem of the Tibetan Plateau (TP), a climate-sensitive area. In particular, winter frost, freezing events and snow avalanche frequently causing severe effects on ecosystem and social economy, however, few long-term winter temperature records or reconstructions hinder a better understanding on variations in winter temperature in the vast area of the TP. In this paper, we present a minimum winter (November–February) temperature reconstruction for the past 668 years based on a tree-ring network (12 new tree-ring chronologies) on the southeastern TP. The reconstruction exhibits decadal to inter-decadal temperature variability, with cold periods occurring in 1423–1508, 1592–1651, 1729–1768, 1798–1847, 1892–1927, and 1958–1981, and warm periods in 1340–1422, 1509–1570, 1652–1728, 1769–1797, 1848–1891, 1928–1957, and 1982–2007. … It also shows the possible effects of volcanic eruption and reducing solar activity on the winter temperature variability for the past six centuries on the southeastern TP.”

Vermassen et al., 2019
“A link between the physical oceanography of West Greenland and Atlantic SSTs has indeed been suggested previously: a positive phase of the AMO [Atlantic Multidecadal Oscillation] is related to an increase of warm Atlantic waters flowing towards and along the SE and W Greenland shelf (Drinkwater et al., 2014; Lloyd et al., 2011). … Despite differences in the timing and magnitude of the retreat of the different glaciers, they broadly share the same retreat history. High retreat rates occurred between the mid ‘30s and mid ‘40s (400-800m/yr), moderate retreat rates between 1965-1985 (~200 m/yr, except for Upernavik) and high retreat rates again after 2000 (>200 m/yr). … Since the meridional overturning circulation strength and associated heat transport is currently declining, (Frajka-Williams et al., 2017), this may lead to cooling bottom waters during the next decade in Upernavik Fjord and most likely also other fjords in West-Greenland.”

Kutta and Hubbart, 2019
“Between 1900 and 2016, climatic trends were characterized by significant reductions in the maximum temperatures (−0.78°C/century; p = 0.001), significant increases in minimum temperatures (0.44 °C/century; p = 0.017) [overall -0.34°C per century], and increased annual precipitation (25.4 mm/century) indicative of a wetter and more temperate WV climate. Despite increasing trends of growing degree days during the first (p ≤ 0.015) and second half of the period of record, the long-term trend indicated a decrease in GDD [warm growing degree days] of approximately 100 °C/days.”

Eck et al., 2019
“A majority (12/14) of the regions within the SAM [southern Appalachian Mountains] have experienced a long‐term decline in mean winter temperatures since 1910.”

Deng et al., 2019
“Recent SST records based on longchain alkenones imply that the MCA [Medieval Climate Anomaly] was slightly warmer than the CWP [Current Warm Period] in the northern SCS [South China Sea] (Kong et al., 2017). … [I]t still should be noted that the SST record reconstructed from a Tridacna gigas Sr/Ca profile by Yan et al. (2015a) suggested that the annual average SST was approximately 0.89°C higher during the MCA [Medieval Climate Anomaly] than that of the CWP [Current Warm Period].”

Zhang et al., 2019
“Natural variability of Southern Ocean convection as a driver of observed climate trends … Observed Southern Ocean surface cooling and sea-ice expansion over the past several decades are inconsistent with many historical simulations from climate models. Here we show that natural multidecadal variability involving Southern Ocean convection may have contributed strongly to the observed temperature and sea-ice trends.”

Etourneau et al., 2019
“Based on water stable isotopes calibrated to recent air temperatures [Abram et al., 2013, Mulvaney et al., 2012], the reconstructed mean annual SAT documents a 1.5 °C cooling over the Holocene occurring in two steps between 10,000 and 6000 years before present (BP), and 3500 and 500 years BP. The Holocene cooling was interrupted by a slightly warmer period. The first main cooling episode corresponds to a phase of major EAP [East Antarctic Peninsula] ice shelf retreat reported in the literature [Domack et al., 2005, Cofaigh et al., 2014, Johnson et al., 2011, Davies et al., 2012]. … The Larsen A ice shelf was probably destabilized at least as early as ~6300 years BP [Brachfeld et al., 2003], while evidence show that the Larsen B ice shelf experienced a continuous and significant shrinkage throughout the Holocene [Domack et al., 2005]. Hence, the EAP ice shelves underwent a major retreat mostly between ~8000 and 6000 years BP. … [T]he ice core-derived SAT were overall warmer throughout the Holocene than during the last two millennia and could have hence favored the EAP [East Antarctic Peninsula] ice shelf surface melting during the entire period. … The long-term SOT [subsurface ocean temperatures] increasing trend at the JPC-38 core site was punctuated by up to 1.5 °C warm events at the centennial scale.”

Voelker et al., 2019

Gan et al., 2019
“Daily Minimum temperature (Tmin) is an important variable in both global and regional climate changes, and its variability can greatly affect the ecological system. In the early 21st century, warming slowdown is seen over the North Hemisphere and North America is one of the major cooling centers. … In this study, we found that Tmin experienced an obvious decline in North America during warming slowdown period. Such Tmin decline is closely related to the Atlantic Multidecadal Oscillation (AMO), the correlation between the decadal components of Tmin and AMO reached 0.71 during 1950-2014.”


Li et al., 2019
“On the contrary, there is a cooling trend by 0.29 ± 0.26 °C (10 yr)−1 in northern China during the recent 15 yr, where a warming rate about 0.38 ± 0.11 °C (10 yr)−1 happened for 1960–2000. Overall, satellite simulation shows that the warming rate is reduced to −0.02 °C (10 yr)−1. The changes in underlying surface, Earth’s orbit, solar radiation and atmospheric counter radiation (USEOSRACR) cause China’s temperature rise about 0.02 °C (10 yr)−1. A combination of greenhouse gases (GHGs) and other natural forcing (ONAT, predominately volcanic activity, and atmosphere and ocean circulation) explain another part of temperature trend by approximately −0.04 °C (10 yr)−1. We conclude that there is a regional warming hiatus, a pause or a slowdown in China, and imply that GHGs-induced warming is suppressed by ONAT [other natural forcing] in the early 21st century.”

Kushnir and Stein, 2019
“Medieval Climate in the Eastern Mediterranean: Instability and Evidence of Solar Forcing … The Nile summer flood levels were particularly low during the 10th and 11th centuries, as is also recorded in a large number of historical chronicles that described a large cluster of droughts that led to dire human strife associated with famine, pestilence and conflict. During that time droughts and cold spells also affected the northeastern Middle East, in Persia and Mesopotamia. Seeking an explanation for the pronounced aridity and human consequences across the entire EM, we note that the 10th–11th century events coincide with the medieval Oort Grand Solar Minimum, which came at the height of an interval of relatively high solar irradiance. Bringing together other tropical and Northern Hemisphere paleoclimatic evidence, we argue for the role of long-term variations in solar irradiance in shaping the early MCA in the EM and highlight their relevance to the present and near-term future.”

via NoTricksZone
March 22, 2019 at 07:33AM


