
Over the course of a 12 hour period on a cloudless day, 500 Wm-2 of solar energy pummels past the ocean surface to depths of 20 or more meters, warming up the first 2 meters of the ocean by 2.0 K.
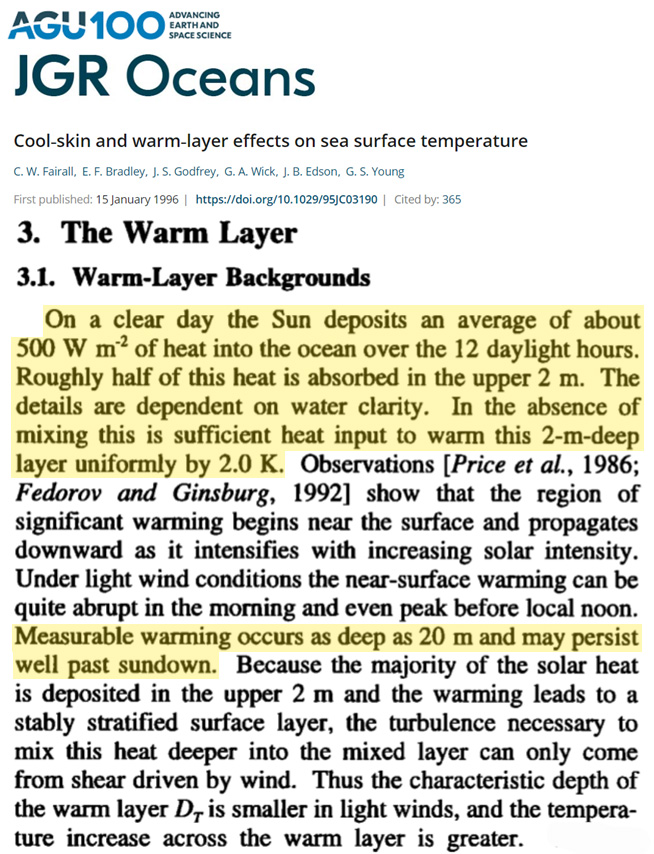
Image Source: Fairall et al., 1996
In contrast, the infrared radiation absorbed and re-emitted in all directions by CO2 molecules cannot penetrate past the ocean’s 0.1 to 1 mm “thick” skin layer.
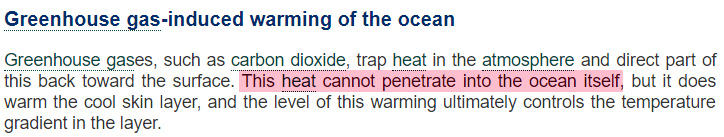
Image Source: Skeptical Science blog
Clouds and Ocean Domination
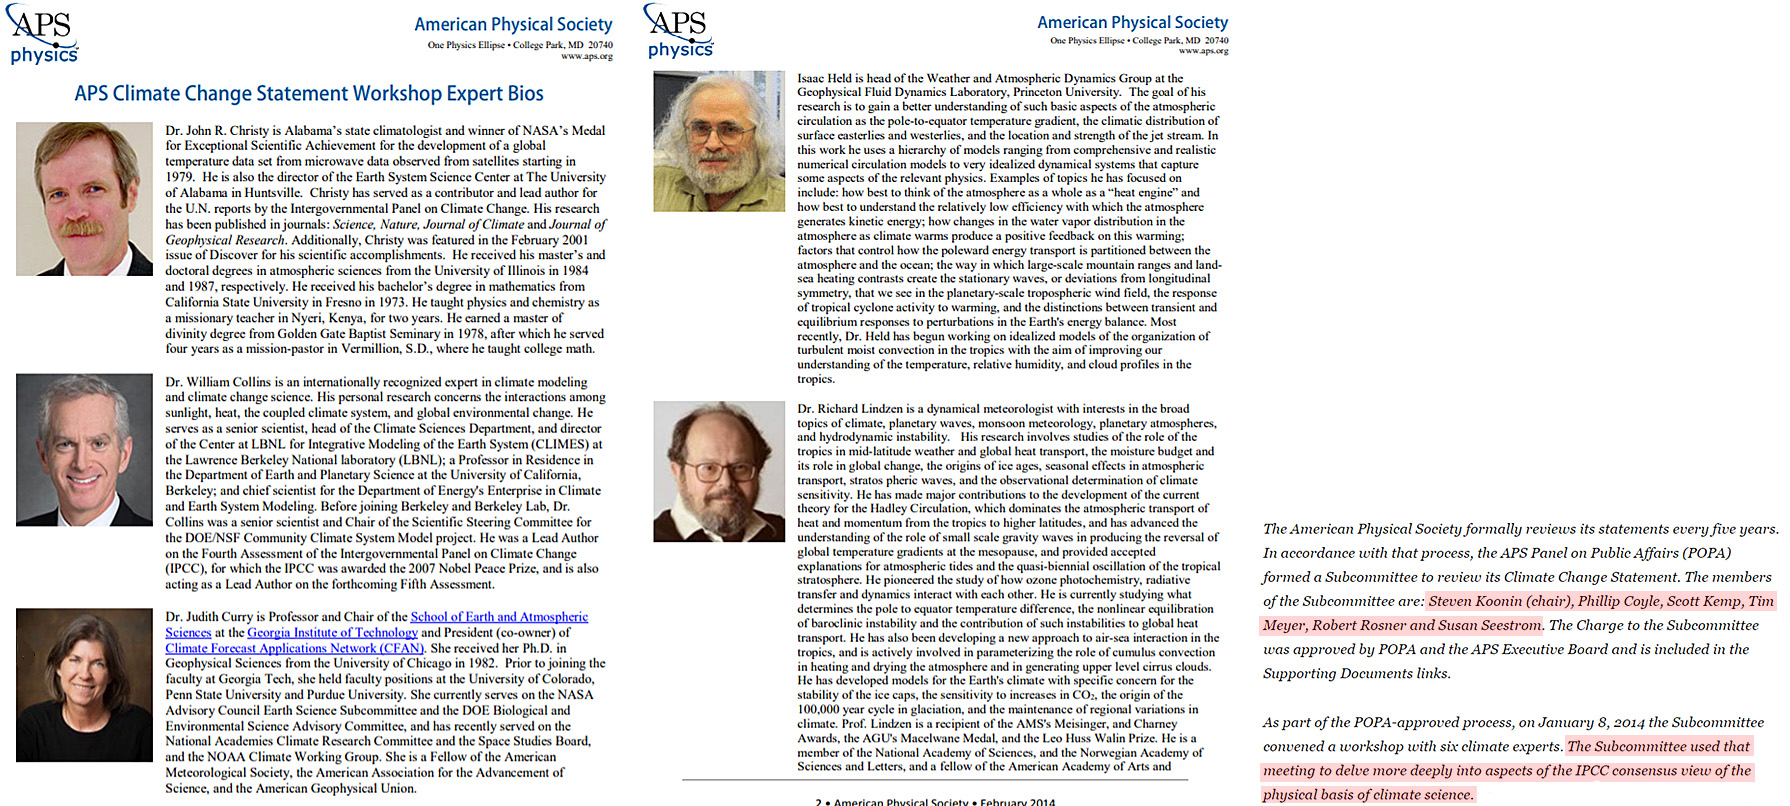
How much solar radiation is absorbed by the Earth system’s heat reservoir – the oceans, where 93% of the globe’s heat energy resides – is significantly determined by changes in decadal-scale cloud cover.
Direct short wave and long wave (i.e., “greenhouse effect”) forcing from the reduction or increase in cloud cover dominates as the modulator of Earth’s energy budget changes.
CO2’s influence is minimal and easily overwhelmed in these processes, as “the greenhouse effect of clouds may be larger than that resulting from a hundredfold increase in the CO2 concentration of the atmosphere.”
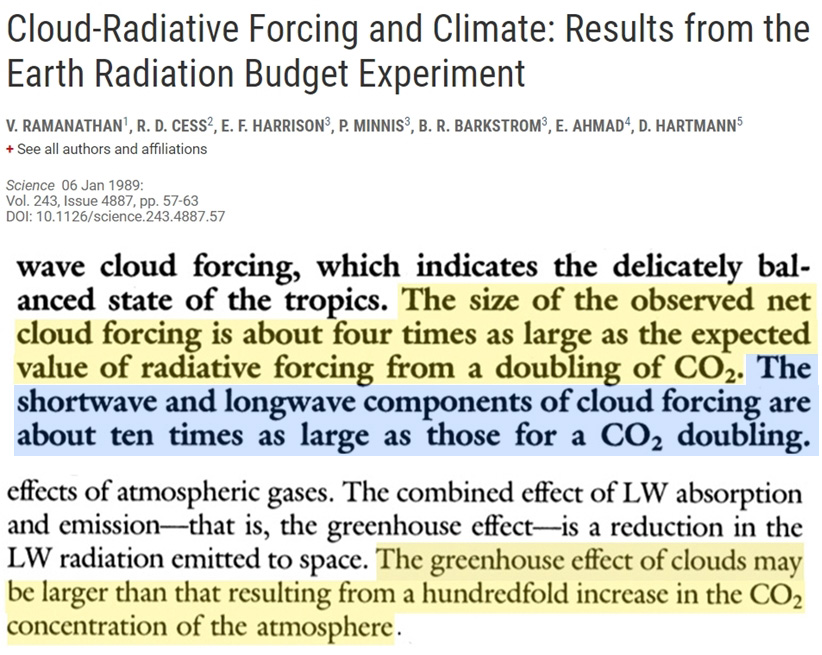
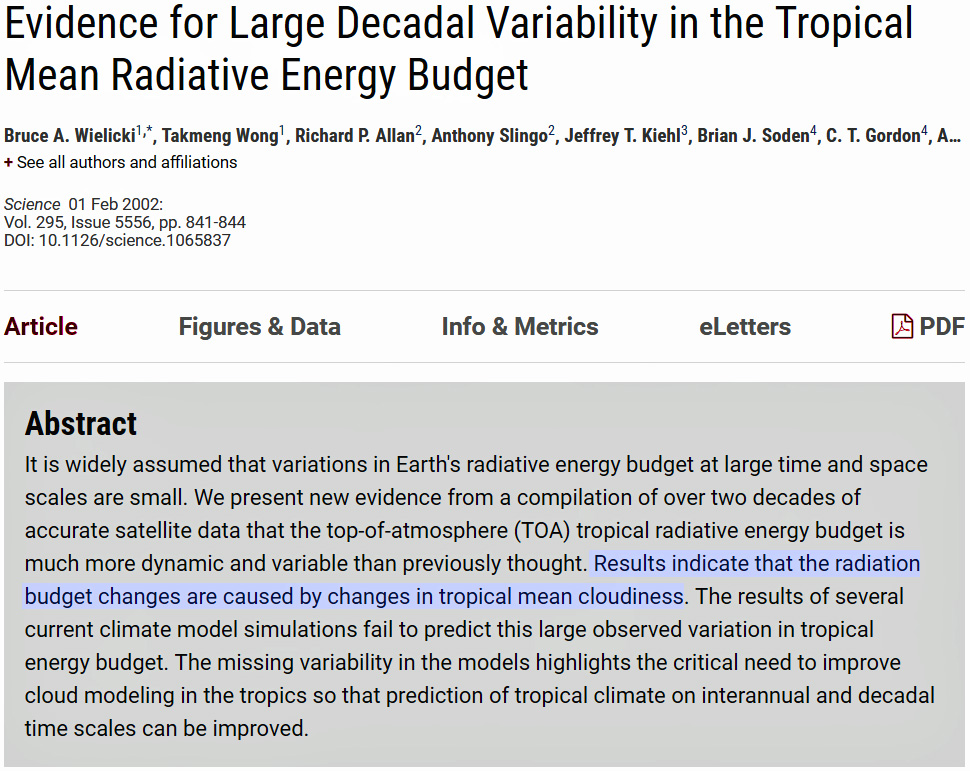
Image Source: Ramanathan et al., 1989, Wielicki et al., 2002
Satellite observations of decadal-scale cloud cover changes indicate that between the 1980s and 2000s about 3 to 6-7 Wm-2 of direct short wave forcing was additionally absorbed by the Earth’s oceans. This may account for the warming trend in recent decades.
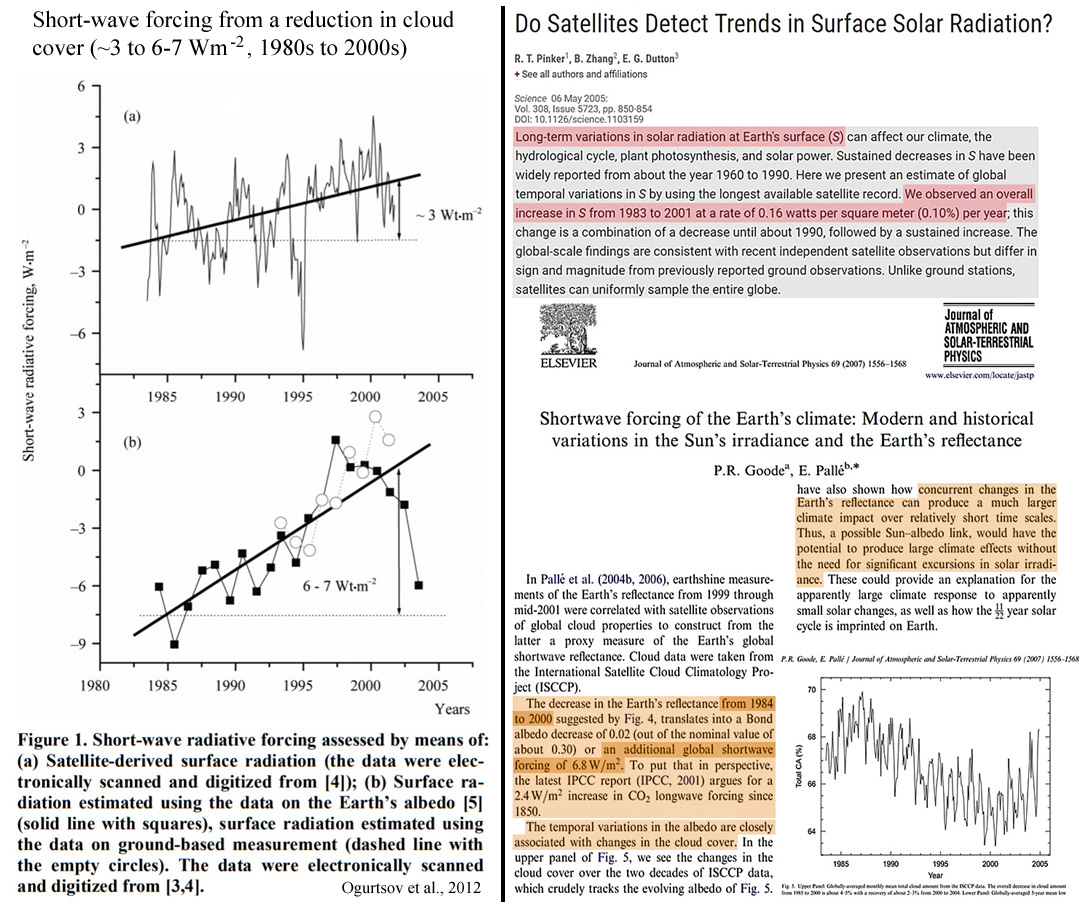
Image Source(s): Ogurtsov et al., 2012 , Pinker et al., 2005, Goode and Palle, 2007
CO2’s Honey Bee-Sized Contribution
According to a widely cited analysis of the CO2 radiative contribution to the Earth’s greenhouse effect, there was a 0.2 Wm-2 per decade forcing associated with a CO2 change of 22 ppm during 2000 to 2010.
The seasonal mean range for DWLWR (downwelling long wave radiation) reaches amplitudes of ~30 Wm-2 over the course of months. This range is more than a 100 times larger than the entire DWLWR CO2 forcing contribution over 11 years.
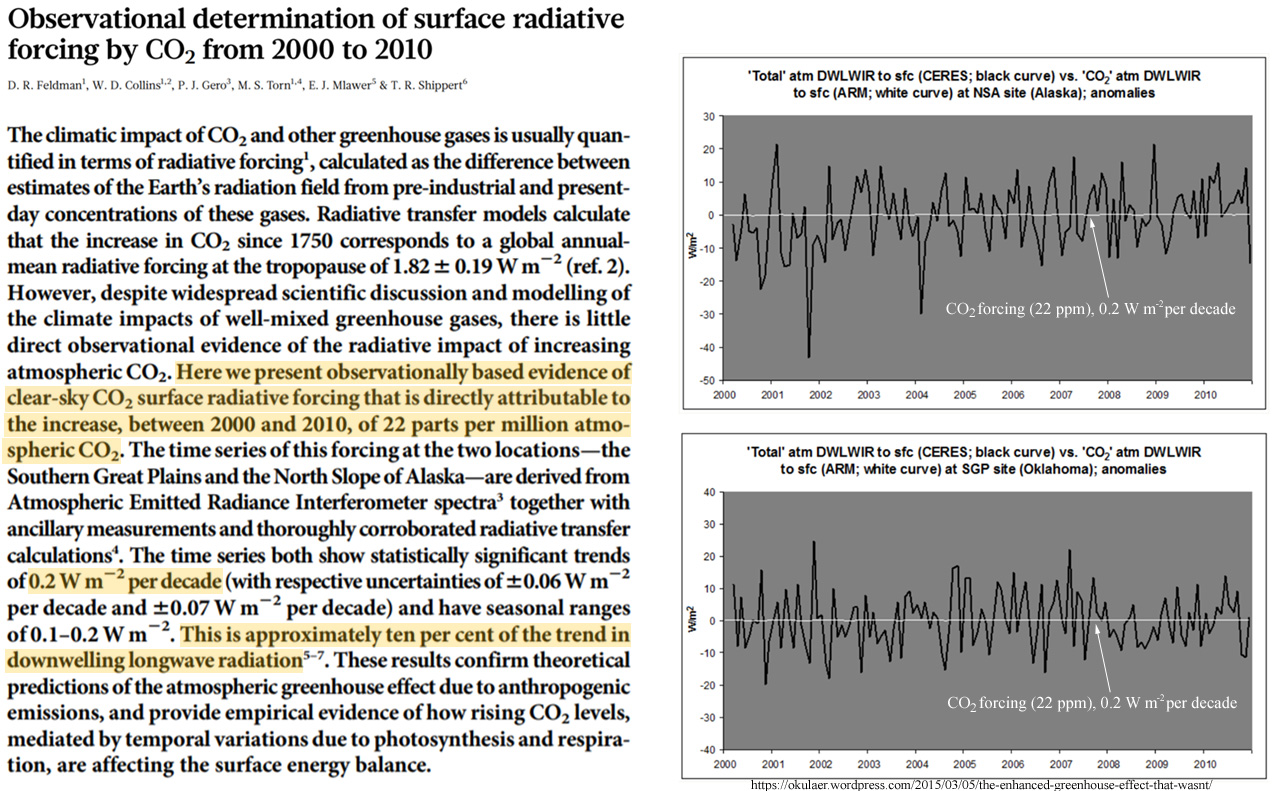
Image Source: Feldman et al., 2015, Okulaer, 2015
CO2 concentration changes are registered in parts per million (ppm, 0.000001). This means that for the 100 ppm rise in CO2 from the last glacial period to the warm interglacial we enjoy now (from ~180 ppm to ~280 ppm), the gaseous representation of CO2 in the atmosphere rose from <2 parts in 10,000 parts to ❤ parts in 10,000 parts.
Since it took about 5,000 years for CO2 to rise by 1 part in 10,000 parts, this is the forcing equivalent of 0.006 Wm-2 per decade using the calculations of Dr. James Hansen (and the IPCC).
A CO2 forcing of 0.006 Wm-2 per decade is “about a third of the energy required to power a honey bee in flight.”
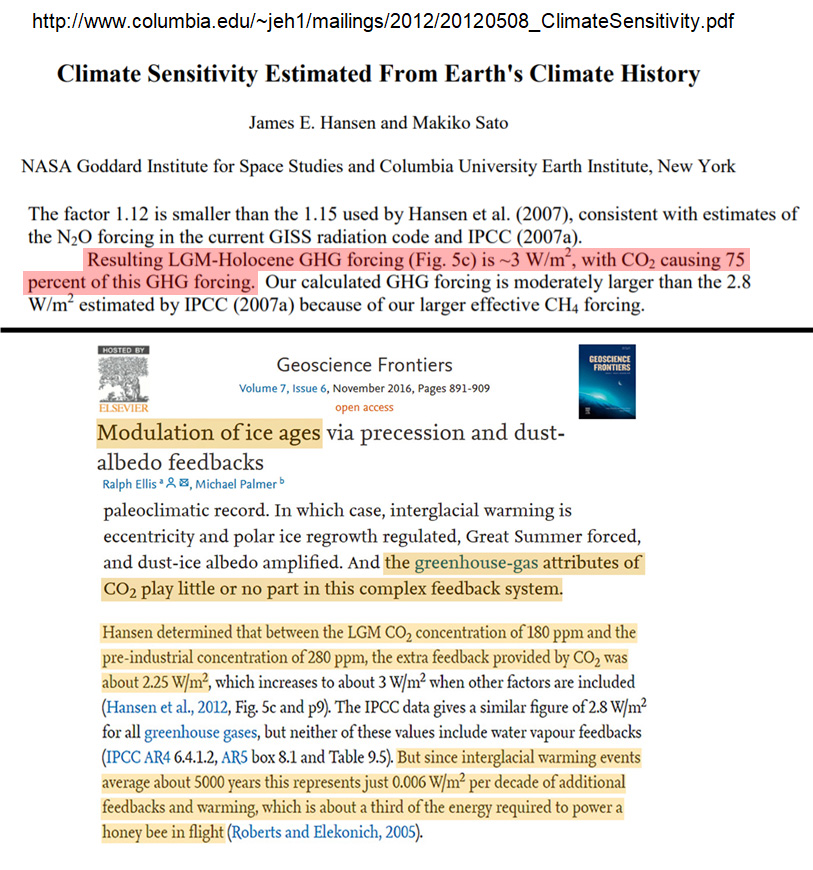 Image Source: Hansen et al., 2012 and Ellis and Palmer, 2016
Uncertainty, Errors 10-100 Times Larger Than CO2 Forcing
According to the Intergovernmental Panel on Climate Change (IPCC), uncertainty in the factors influencing the ocean heat flux reach amplitudes of 20 Wm-2. This uncertainty is more than 10 times larger than the entire forcing contribution from CO2 since 1900 (<2 Wm-2).
“Unfortunately, the total surface heat and water fluxes … are not well observed. The uncertainty in the observational estimate is large – of the order of tens of watts per square metre for the heat flux, even in the zonal mean.” – IPCC AR4 (2007)
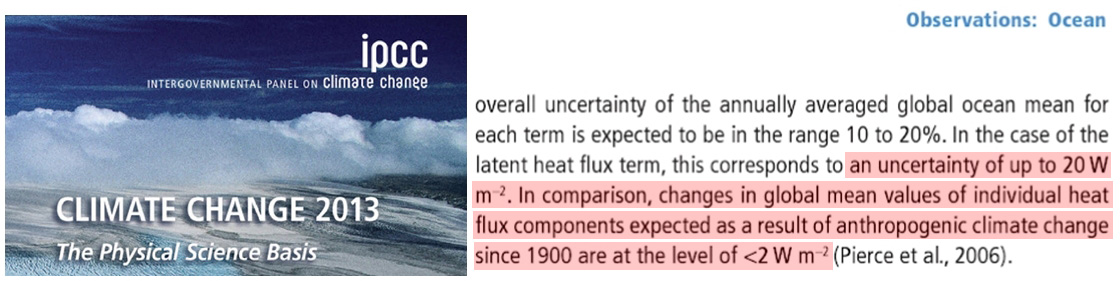
Image Source: IPCC AR5 (2013)
The IPCC also identifies error ranges for long wave (LW) forcing that range between 5-15 Wm-2.
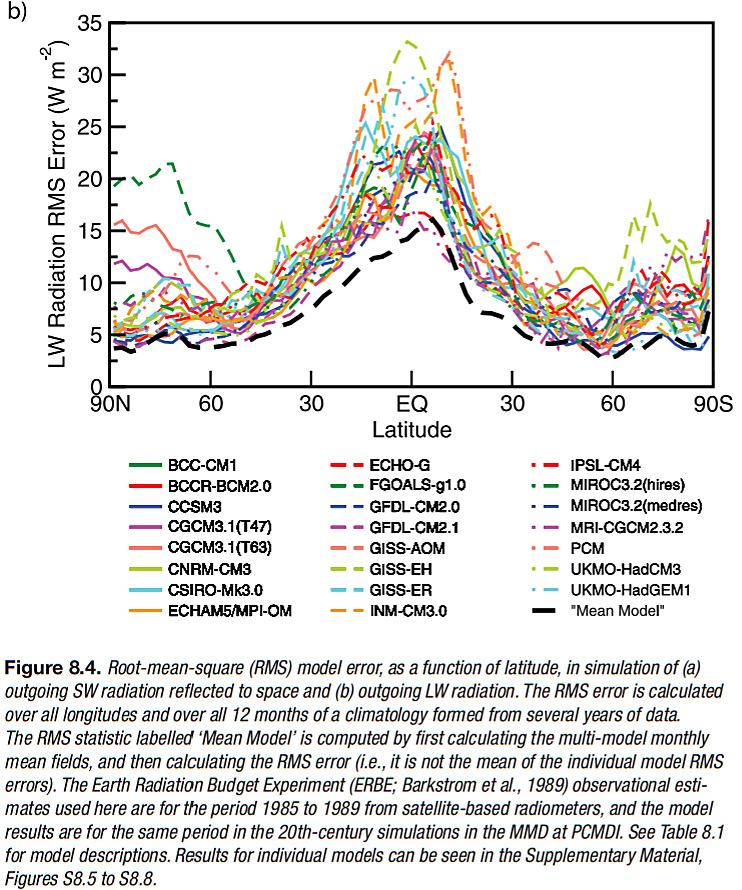
Image Source: IPCC AR4 (2007)
The Earth’s energy budget is assumed to be imbalanced, as more energy is said to be absorbed by the system than leaving it.
During 2000-2010, Earth’s energy imbalance was believed to be 0.6 Wm-2. The uncertainty range for this value was ±17 Wm-2, meaning the energy imbalance could have ranged anywhere from -16.4 Wm-2 to +17.6 Wm-2, which is more than ten times larger than “the changes to the net surface fluxes associated with increasing greenhouse gases in the atmosphere.”
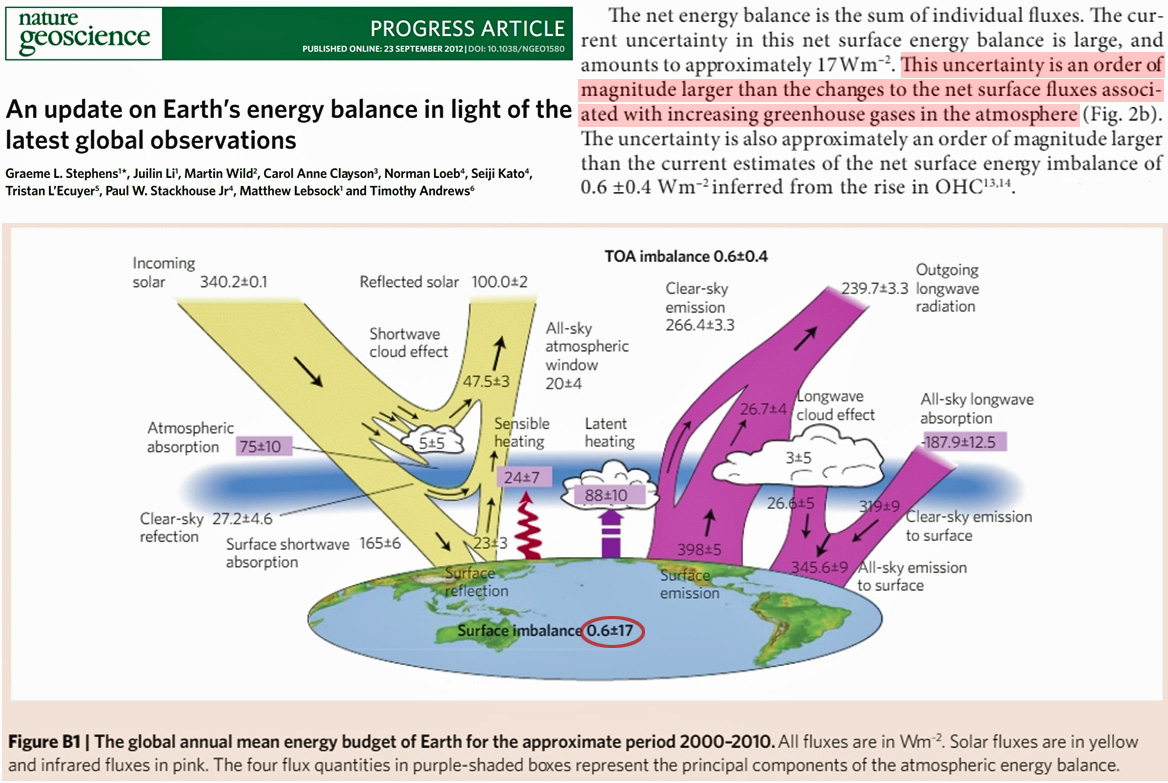
Image Source: Stephens et al., 2012
The ARGO data measuring ocean heat content launched in the early 2000s, but the coverage still leaves much of the non-uniformly warming and cooling regions of the ocean unsampled. Sampling errors can range anywhere from 10 to 200 Wm-2.
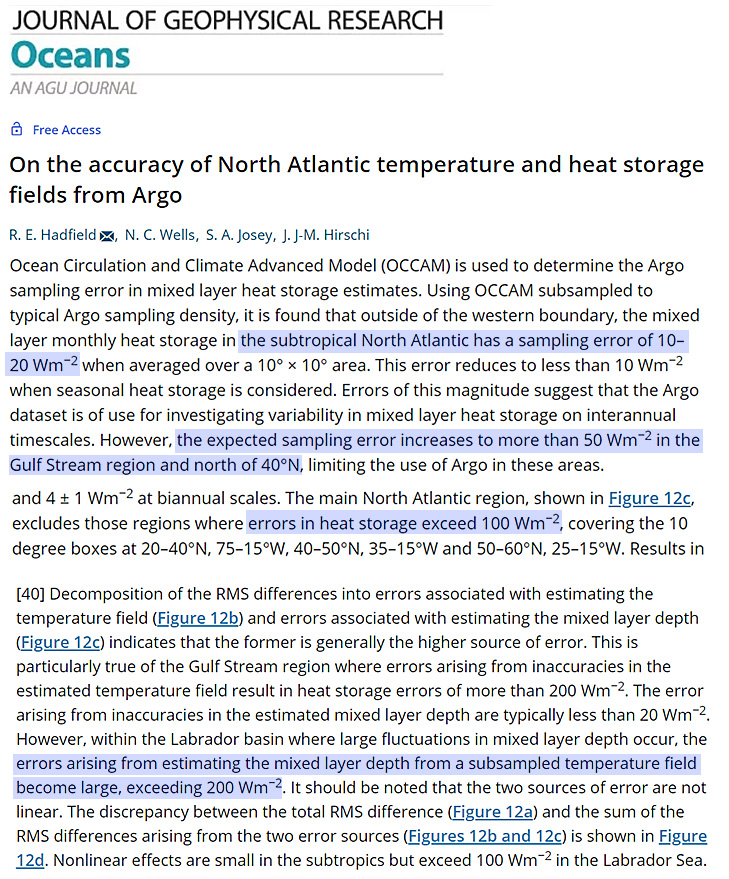
Image Source: Hadfield et al., 2007
Renowned Climate Scientists Ask A Never-Answered Question
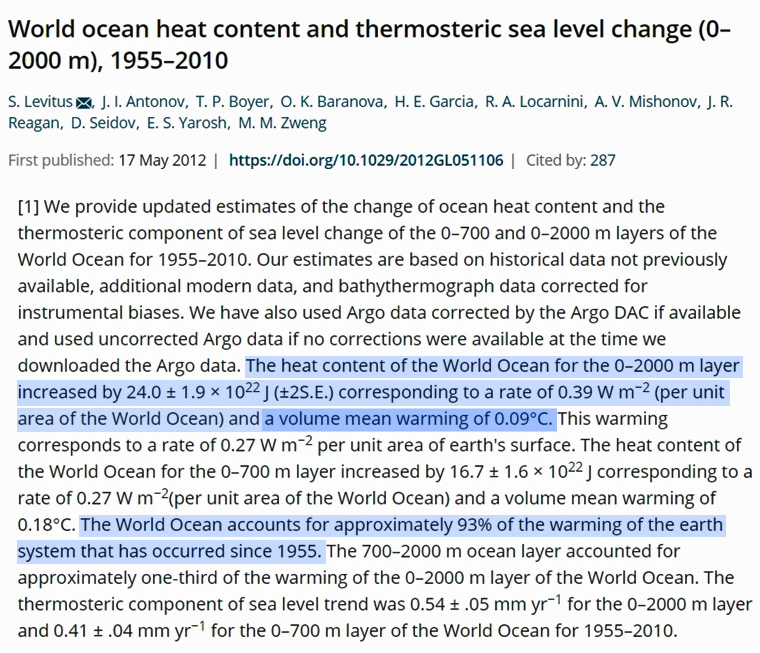
In late 2013, five American Physical Sociey (APS) climate scientists published a framing document designed to re-examine the physical basis for the IPCC’s “consensus” position(s) on climate change.
Using the IPCC’s acknowledgement of ocean data uncertainty and low confidence that an anthropogenic signal can be detected amid the noise of natural variability, a cogent question was posed pertaining to the claims of certainty that humans exert fundamental control over the the climate of the Earth system.
The question has never been answered.
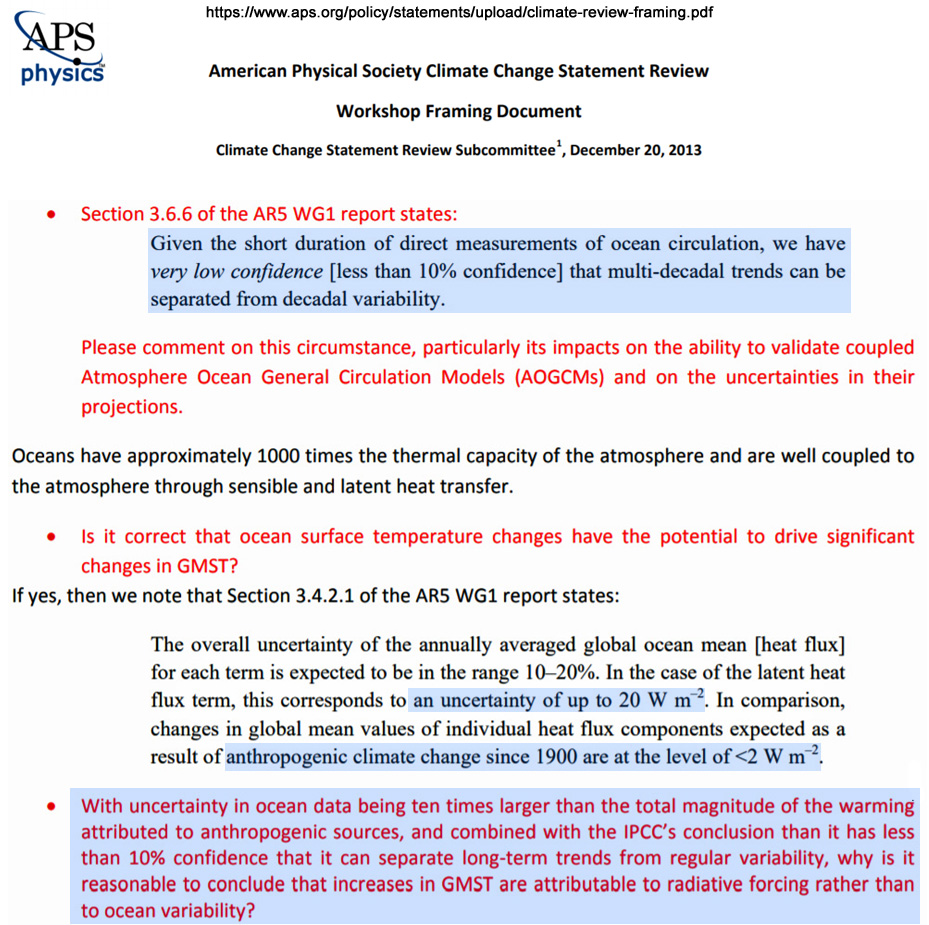
Image Source: American Physical Society
via NoTricksZone
May 13, 2019 at 09:38AM
