
Guest geology lesson by David Middleton
What’s wrong with the following paragraph?
In Late Jurassic-Early Cretaceous times, Gondwana was split apart, and as rift volcanism and sea-floor spreading developed, ocean temperatures rose and ocean waters were enriched with nutrient elements from volcanic outpourings (along mid-ocean ridges and continental margins or island arcs). Oxygen-isotope analyses of marine limestones have shown that 125-85 Ma was a time of severe global warming due to a rapid increase in atmospheric carbon dioxide concentrations (mainly from increased volcanic activities). This is consistent with sequence stratigraphic evidence for sea-level maxima in mid-late Cretaceous times. Warm climate, high-stand seas and increases in the nitrogen-phosphorus-carbon contents of oceans, in turn, led to a profuse radiation of plankton populations – a key factor in the organic richness of marine sediments laid down during that period. Neo-Tethys most benefited from these events and the Middle East was in the right position at the right time.
The assumption that mid-late Cretaceous warmth and sea level rise were due to high atmospheric CO2 levels and that the high CO2 levels can be directly related to increased volcanic activity are what’s wrong with it. This is geology done bass-ackwards. It’s an unfortunate blemish on an otherwise outstanding article. And, unfortunately, I think it reflects a shift from Chamberlin’s Method of Multiple Working Hypotheses toward paradigm-driven geological thinking among many academic geoscientists.
“The present is the key to the past”
This basic principle of geology is often attributed to James Hutton, and forms the basis of uniformitarianism.
The past history of our globe must be explained by what can be seen to be happening now. No powers are to be employed that are not natural to the globe, no action to be admitted except those of which we know the principle.
While both of Dr. Sorkhabi’s assumptions reflect plausible cause and effect relationships, the certainty of the first assumption is based almost entirely on the postmodernist assumption that climate change has generally been driven by atmospheric carbon dioxide levels over geologic time. It is an assumption based upon another assumption. This is the antithesis of how geology is supposed to work. Neither assumptions about the present, nor model-predictions about the future, constitute observations of geological processes.
While we do have observations of volcanic outgassing of carbon dioxide, evidence that carbon dioxide is a “greenhouse” gas and that, all other factors held equal, an increase in atmospheric carbon dioxide will modestly elevate the bulk temperature of the atmosphere, there is absolutely no evidence that it is capable of driving the degree of warming that occurred in the mid-late Cretaceous Period or any of the Cenozoic thermal maxima or climatic optima, primarily inferred from oxygen isotope chronologies.
Most current observation-derived estimates of the climate sensitivity to carbon dioxide only put the transient climate response (TCR) in the 0.5 to 1.5 °C range and the equilibrium climate sensitivity (ECS) in the 1.5 to 2.5 °C range, insufficient to have been a primary driver of Phanerozoic climate change.


The second assumption, that the high CO2 levels can be directly related to increased volcanic activity during the mid-late Cretaceous Period, is not well-supported by any observations, present or past.

The highest Cretaceous CO2 levels preceded the 125-115 Ma peak in volcanic activity by 15 million years.

The notion of Phanerozoic Eon climate change being driven by atmospheric carbon dioxide levels was generally scoffed at as recently as the 1970’s.
Suggestion that changing carbon dioxide content of the atmosphere could be a major factor in climate change dates from 1861, when it was proposed by British physicist John Tyndall.
[…]
Unfortunately we cannot estimate accurately changes of past CO2 content of either atmosphere or oceans, nor is there any firm quantitative basis for estimating the the magnitude of drop in carbon dioxide content necessary to trigger glaciation. Moreover the entire concept of an atmospheric greenhouse effect is controversial, for the rate of ocean-atmosphere equalization is uncertain.
Dott & Batten, 1976
While a great deal of progress has been made since 1976 in estimating changes of past CO2 content, it is still not accurate enough to draw the conclusion that CO2 has been a major climate driver over the Phanerozoic Eon. Royer et al., 2004 employed a pH-corrected Phanerozoic temperature reconstruction to assert that CO2 was a major driver of Phanerozoic climate change. The Royer temperature series was smoothed to a 10 million year sample interval matching Berner’s GeoCarb III, thus facilitating crossplotting.

It yields a climate sensitivity of 1.28 °C per doubling of atmospheric CO2, very much inline with most recent, observation-derived, low climate sensitivities. Royer’s pH corrections were derived from CO2; so it shouldn’t be too much of a surprise that the correlation was so good (R² = 0.6701)… But the low climate sensitivity would seem to fall just a bit shy of “a primary driver of Phanerozoic climate.”
If we look at the mid-late Cretaceous period, we can see that the volcanism–>CO2 –>warming narrative doesn’t quite work. Even if the climate sensitivity is 1.28 °C per doubling of CO2… CO2 was declining during the 125-85 Ma “time of severe global warming” Dr. Sorkhabi associates with extremely prolific mid-late Cretaceous hydrocarbon source rocks.

The Columbia River Flood Basalt Eruptions and the Mid-Miocene Climatic Optimum

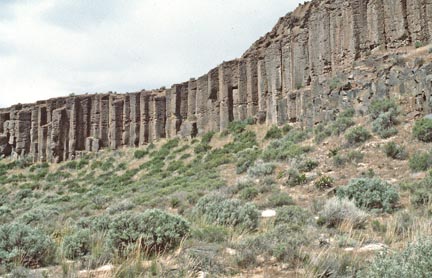
Flood basalt eruption sequences (also known as Large Igneous Provinces) are almost unimaginable in scale. Two of the most infamous are the Siberian Traps, associated with the worst mass extinction in the fossil record (Permian-Triassic) and the Deccan Traps, contemporaneous with the Cretaceous-Paleogene (K-Pg) extinction. “Traps” refers to “trap rock”, “a construction industry term used for dark-colored igneous rocks used to make crushed stone” (King). Basalt and its shallow intrusive variety, Diabase or Dolerite, is the most common type of trap rock.
It is very fortunate for the human race that Earth hasn’t delivered any major flood basalt eruption sequences since the mid-Miocene Period. Continental flood basalts are highly correlated with Phanerozoic mass extinction events.

I recently authored a WUWT post on the Paleocene-Eocene Thermal Maximum and its dubious relationship to the flood basalts of the North Atlantic Large Igneous Province. This post will focus on the most recent, and best preserved flood basalt sequence of the Columbia River Basalt Group (CRBG) and the Mid-Miocene Climatic Optimum.
According to Kashbohm & Schoene (2018)…
Flood basalts, the largest volcanic events in Earth history, are thought to drive global environmental change because they can emit large volumes of CO2 and SO2 over short geologic time scales. Eruption of the Columbia River Basalt Group (CRBG) has been linked to elevated atmospheric CO2 and global warming during the mid-Miocene climate optimum (MMCO) ~16 million years (Ma) ago. However, a causative relationship between volcanism and warming remains speculative, as the timing and tempo of CRBG eruptions is not well known. We use U-Pb geochronology on zircon-bearing volcanic ash beds intercalated within the basalt stratigraphy to build a high-resolution CRBG eruption record. Our data set shows that more than 95% of the CRBG erupted between 16.7 and 15.9 Ma, twice as fast as previous estimates. By suggesting a recalibration of the geomagnetic polarity time scale, these data indicate that the onset of flood volcanism is nearly contemporaneous with that of the MMCO.
It does appear that the timing of the vast majority CRBG eruptions can be fairly well tied down to a 700,000 to 900,000 year period coincident with the Mid-Miocene Climatic Optimum. However, even with the prodigious volume of CO2 associated with flood basalt eruptions, it’s not enough to significantly move the “climate needle”:
A statistic : It is estimated that an erupting basalt lava flow with a volume of 2000 km3would release approximately 7 billion tonnes of carbon (or 26 billion tonnes of CO2).
This is about the same as the amount currently released by burning of fossil fuels – each year.
Armstrong McKay et al., 2014 estimated that the main phase of the CRBG eruptions, along with “cryptic degassing” of country rock, etc., emitted 4,090 to 5,670 billion tons of carbon over a 900,000 period. This only works out to 5-6 million tonnes of carbon per year… That’s an order of magnitude less than a rounding error. Our current 10 billion tonnes per year is only equivalent to 3% of the total annual sources in the Earth’s carbon budget. Self et al., 2005 found that CO2 emissions from flood basalt eruptions were insignificant relative to the mass of CO2 in the atmosphere and unlikely to have played a signifcant role in past episodes of “global warming.” Although they did note that the sulfur gas emissions may truly have been unprecedented.
While the impact of volcanic S gas release may be profound, the mass of CO2 directly released by individual flood lava eruptive events is tiny in comparison to the normal mass in the troposphere and stratosphere. The predicted increases in atmospheric concentration are a fraction of the current anthropogenic CO2 released from hydrocarbon burning (~25 Gt per year). Moreover, while the amount of CO2 in the atmosphere is currently ~3000 Gt, it was perhaps double this value during the late Cretaceous (i.e. ~6000 Gt). It is therefore unlikely that volcanic CO2 had a direct effect on mechanisms of global warming, supporting earlier findings by Caldeira and Rampino (1990). In addition, there would have been more than sufficient time for the extra mass of CO2 added to equilibrate, given that the lava-forming eruptive events must have been spaced at least hundreds, and probably thousands, of years apart. By contrast, SO2 emissions and the atmospheric burden of sulfate aerosols generated during flood basalt events appear to be unprecedented at any other time in Earth history. Acid rain may also have been widespread. What is less certain is whether affected biota would have had time to recover from the deleterious effects of sulfate aerosol clouds and acid rain, although quiescent intervals lasting millennia appear to offer ample time for the recovery of local biological and environmental systems (Jolley 1997).
Self et al., 2005
This ultimately takes us full-circle back to my Historical Geology textbook…
Unfortunately we cannot estimate accurately changes of past CO2 content of either atmosphere or oceans, nor is there any firm quantitative basis for estimating the the magnitude of drop in carbon dioxide content necessary to trigger glaciation. Moreover the entire concept of an atmospheric greenhouse effect is controversial, for the rate of ocean-atmosphere equalization is uncertain.
Dott & Batten, 1976
We can’t even be certain that the atmospheric concentration of CO2 during the Mid-Miocene Climatic Optimum was significantly elevated relative to the extremely low values of the Quaternary Period.

We can see that the range of estimates for MMCO range from 250 to 500 ppm, rendering any efforts to draw conclusions about the CRBG, CO2, MMCO totally pointless. According to Pagani et al, 1999:
There is no evidence for either high pCO2 during the late early Miocene climatic optimum or a sharp pCO2 decreases associated with
EAIS growth.Pagani et al., 1999
Pagani et al., suggest that changes in oceanic circulation driven by plate tectonics (opening of the Drake Passage) and the presence (or lack thereof) of a large polar ice sheet were the primary drivers of Miocene climate change. And this takes us to another of my 1970’s Earth Science textbooks:
FORECASTING THE FUTURE. We can now try to decide if we are now in an interglacial stage, with other glacials to follow, or if the world has finally emerged from the Cenozoic Ice Age. According to the Milankovitch theory, fluctuations of radiation of the type shown in Fig. 16-18 must continue and therefore future glacial stages will continue. According to the theory just described, as long as the North and South Poles retain their present thermally isolated locations, the polar latitudes will be frigid; and as the Arctic Ocean keeps oscillating between ice-free and ice-covered states, glacial-interglacial climates will continue.
Finally, regardless of which theory one subscribes to, as long as we see no fundamental change in the late Cenozoic climate trend, and the presence of ice on Greenland and Antarctica indicates that no change has occurred, we can expect that the fluctuations of the past million years will continue.
Donn, William L. Meteorology. 4th Edition. McGraw-Hill 1975. pp 463-464
Despite only having 12 years to solve the “climate crisis,” we are still living in an Ice Age, and will be so long as Antarctica remains isolated over the southern polar region, Greenland retains its ice sheet and the northern polar region retains at least seasonal ice cover.

The roughly 1.0 °C of warming since the coldest climatic period of the Holocene, the Little Ice Age, hasn’t budged us out of the Quaternary Period temperature “noise level.”

Another 0.5 to 1.0 ºC between now and the end of the century doesn’t even put us into Eemian climate territory, much less the Miocene or even the Pliocene. We will still be in the Quaternary Period noise level. Bear in mind that the instrumental temperature data are of much higher resolution than the δ18O derived temperatures. As such, the δ18O data reflect the bare minimum of dynamic amplitude range. Actual paleo temperatures would have reflected a far greater range of variability (higher highs and lower lows).
Closing Remarks
In no way was this essay intended to diminish the work of Armstrong McKay et al., 2014 and Kasbohm et al., 2018 or any of the other works cited here. Their work on pinning down the timing of the CRBG eruptions and modeling the carbon dioxide emissions was incredibly impressive. I highly recommend both papers. I would like to thank David Armstrong McKay for kindly sending me a copy of his paper. I also recommend the University of Leicester website on flood basalts and large igneous provinces (Saunders & Reichow), fascinating reading.
The main point of this post was to highlight a false paradigm that seems to be progressively infecting academia.
References
Armstrong McKay, David, Toby Tyrrell, Paul A. Wilson, & Gavin Foster. (2014). “Estimating the impact of the cryptic degassing of Large Igneous Provinces: A mid-Miocene case-study”. Earth and Planetary Science Letters. 403. 254–262. 10.1016/j.epsl.2014.06.040. Special thanks to David Armstrong McKay for kindly sending me a copy of his paper.
Berner, R.A. and Z. Kothavala, 2001. GEOCARB III: A Revised Model of Atmospheric CO2 over Phanerozoic Time, American Journal of Science, v.301, pp.182-204, February 2001.
Donn, William L. Meteorology. 4th Edition. McGraw-Hill 1975. pp 463-464
Dott, Robert H. & Roger L. Batten. Evolution of the Earth. McGraw-Hill, Inc. Second Edition 1976. p. 441.
Illis, B. 2009. “Searching the PaleoClimate Record for Estimated Correlations: Temperature, CO2 and Sea Level”. Watts Up With That?
Kasbohm, Jennifer, and Blair Schoene. “Rapid Eruption of the Columbia River Flood Basalt and Correlation with the Mid-Miocene Climate Optimum.” Science Advances, American Association for the Advancement of Science, 1 Sept. 2018, advances.sciencemag.org/content/4/9/eaat8223.
King, Hobart M. “Trap Rock.” Geology, geology.com/articles/trap-rock/.
Pagani, Mark, Michael Arthur & Katherine Freeman. (1999). “Miocene evolution of atmospheric carbon dioxide”. Paleoceanography. 14. 273-292. 10.1029/1999PA900006.
“Rate of Ocean Crust Production.” lect7-4, University of Leicester, http://bit.ly/2HRSwfz.
Royer, D. L., R. A. Berner, I. P. Montanez, N. J. Tabor and D. J. Beerling. “CO2 as a primary driver of Phanerozoic climate”. GSA Today, Vol. 14, No. 3. (2004), pp. 4-10
Saunders, Andy, and Marc Reichow. “Flood Basalts and Mass Extinctions.” Flood Basalts and Mass Extinctions, University of Leicester, 6 Mar. 2009, http://bit.ly/2xlVYXf.
Self, Stephen & Thordarson, Thorvaldur & Widdowson, Mike. (2005). “Gas Fluxes from Flood Basalt Eruptions”. Elements. 1. 10.2113/gselements.1.5.283.
Sorkhabi, Rasoul, and Thomas Smith. “Why So Much Oil in the Middle East?” GEO ExPro, 2010, http://bit.ly/2qcsniH.
Tripati, A.K., C.D. Roberts, and R.A. Eagle. 2009. “Coupling of CO2 and Ice Sheet Stability Over Major Climate Transitions of the Last 20 Million Years”. Science, Vol. 326, pp. 1394 1397, 4 December 2009. DOI: 10.1126/science.1178296
Zachos, J. C., Pagani, M., Sloan, L. C., Thomas, E. & Billups, K. “Trends, rhythms, and aberrations in global climate 65 Ma to present”. Science 292, 686–-693 (2001).
Featured Image
via Watts Up With That?
June 3, 2019 at 12:54PM

Reblogged this on Climate- Science.
LikeLike