
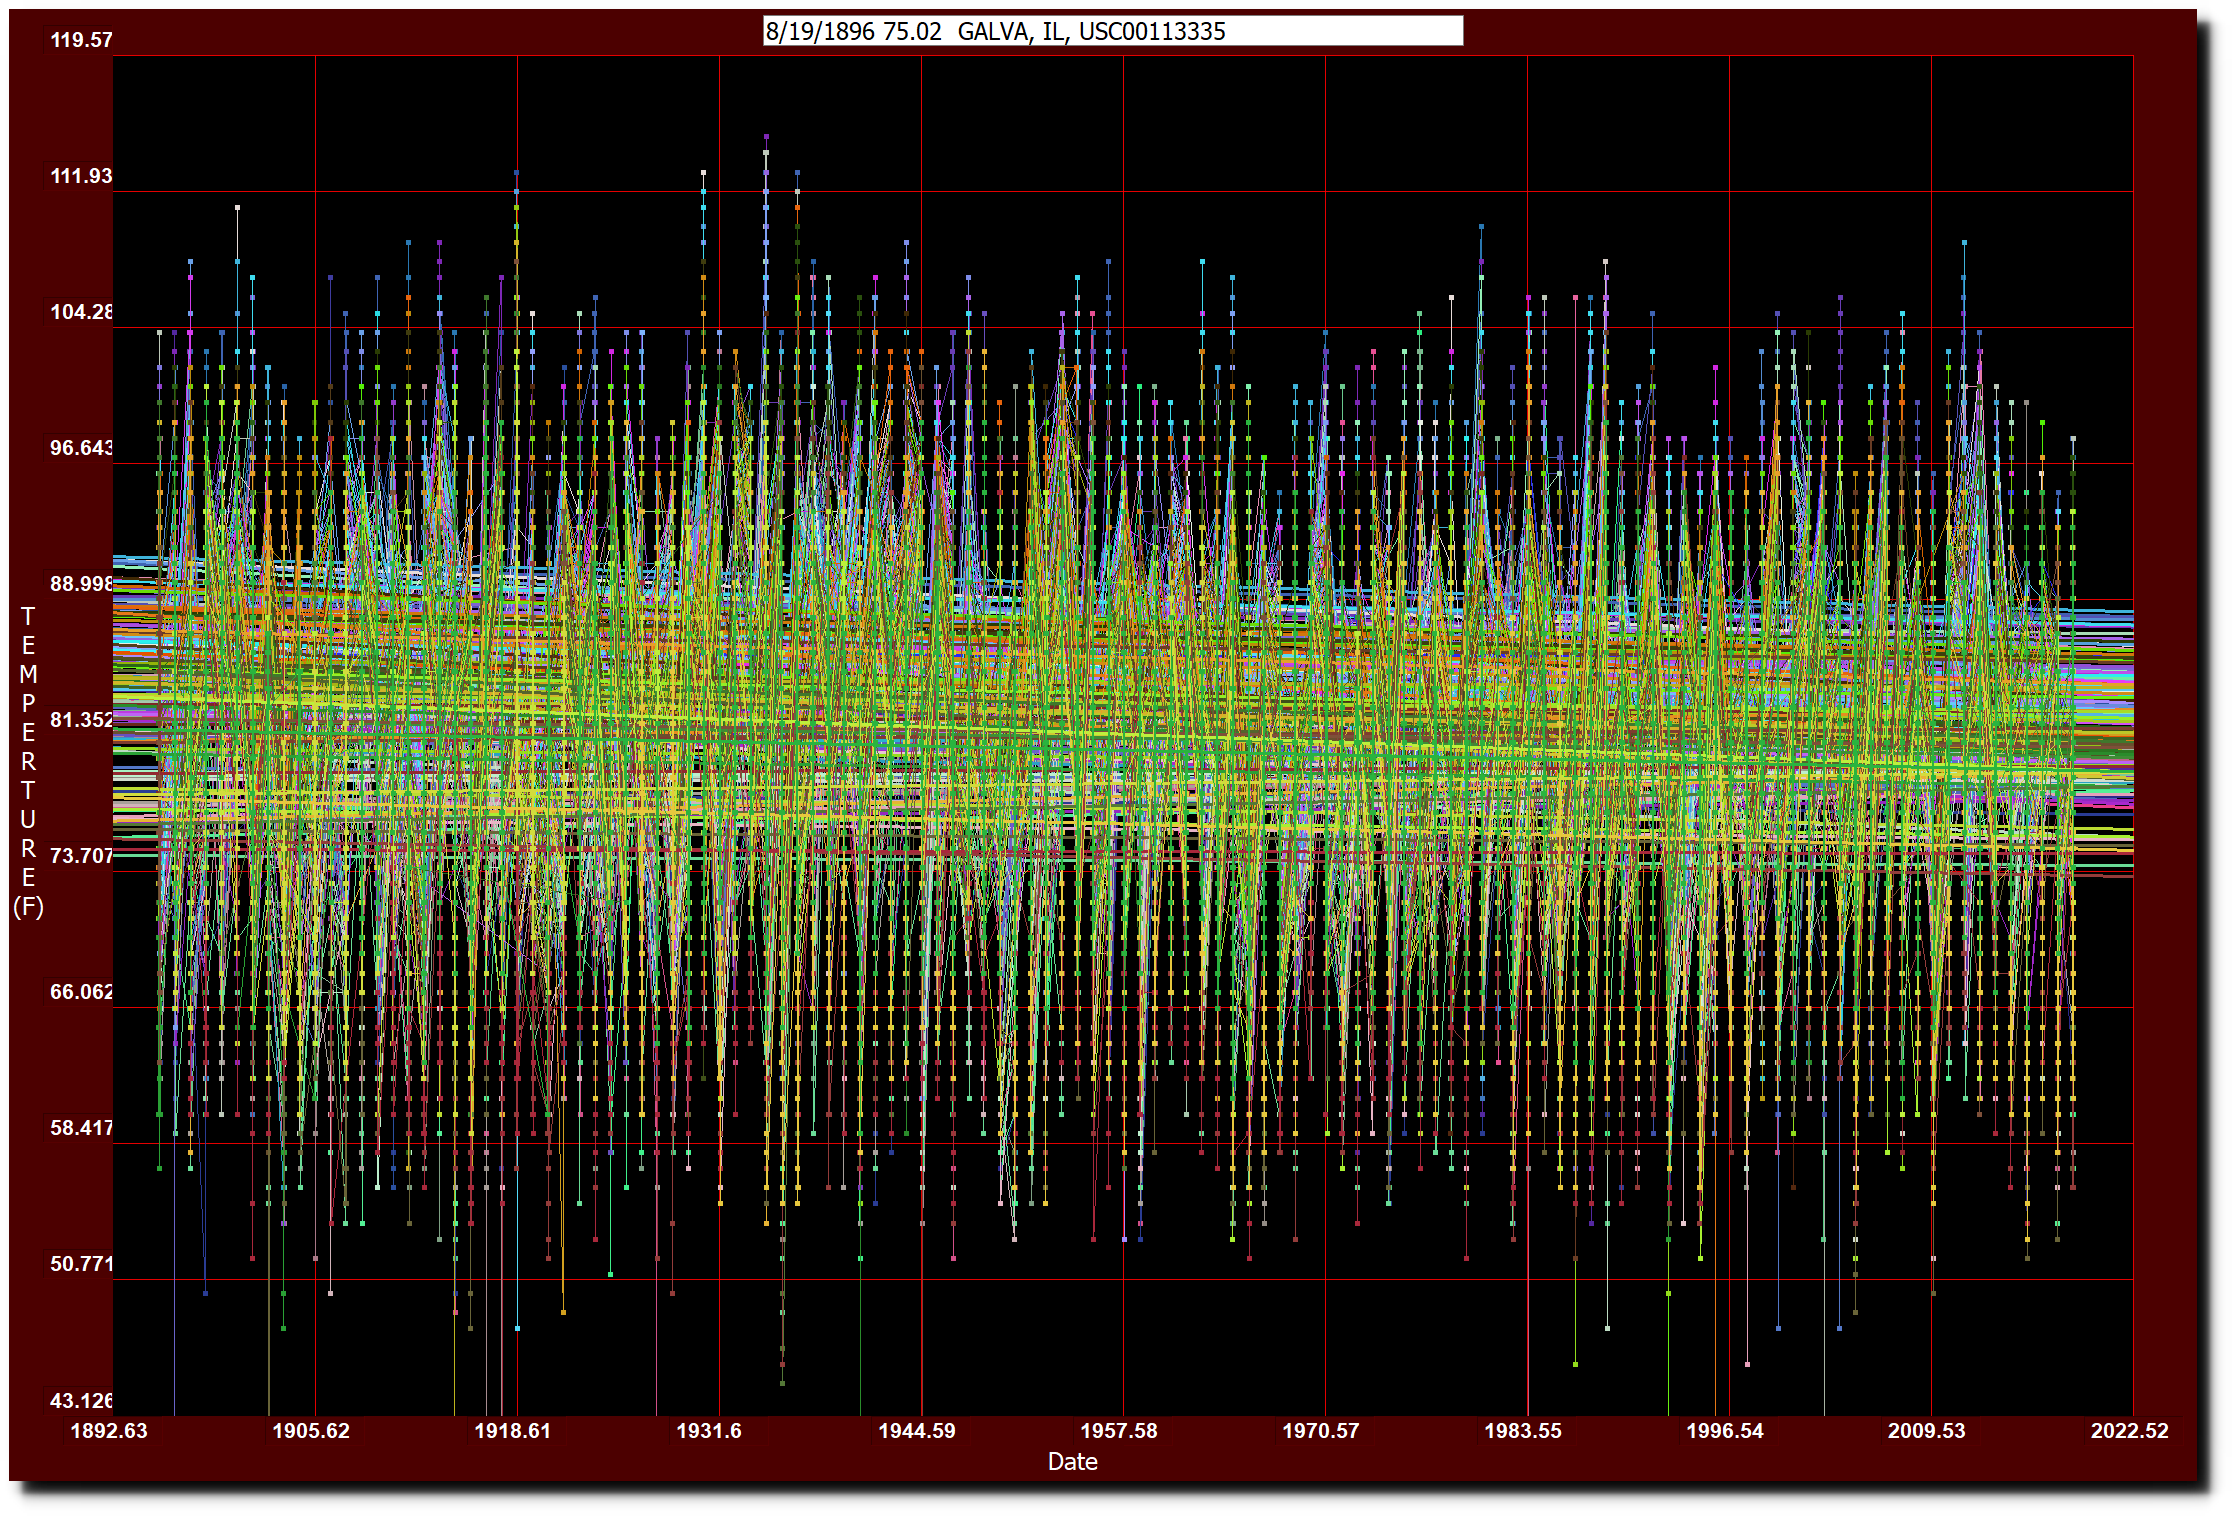
The graph below plots every August daily maximum temperature at all 189 USHCN Midwest stations since 1895 (666,188 readings) – with trendlines for each station.
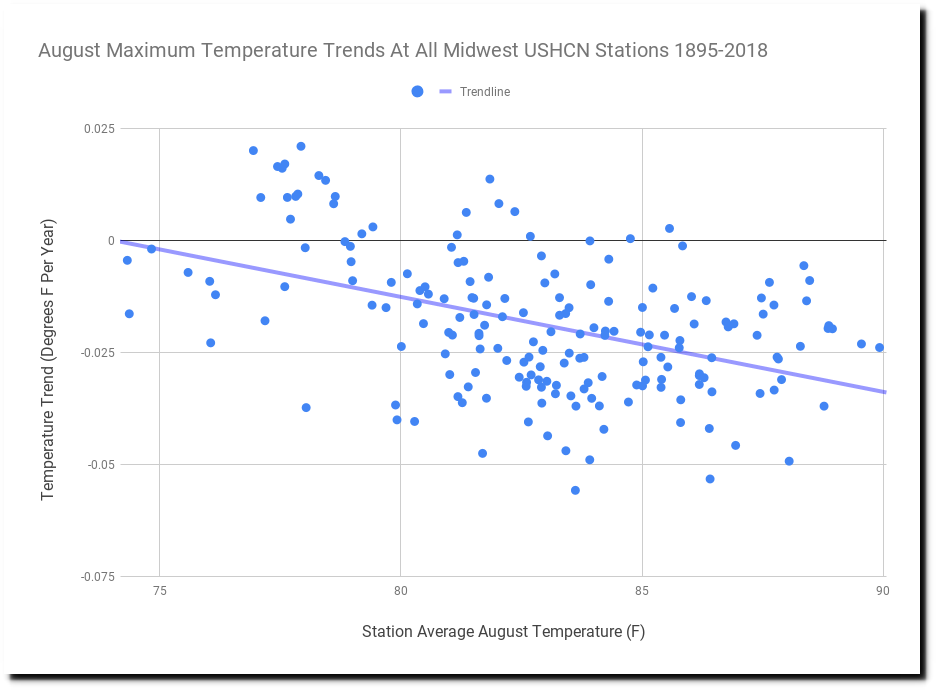
Eighty-eight percent of the stations are cooling, with the warmest stations cooling the fastest
via The Deplorable Climate Science Blog
August 7, 2019 at 09:47AM
