
Guest “geologist tag-teaming” by David Middleton
This is a follow up to Gregory Wrightstone’s article from yesterday. A couple of the first few comments reminded me that I’ve been meaning to write a post on the Rutgers University Global Snow Lab and what their data has to say about “the snows of yesteryear” and the faux climate crisis du jour.
First the comments:
First, Loydo
While it appears that Greenland has lost about 0.4% of its ice mass since 1900, that loss began at the end of the Little Ice Age, the coldest climatic episode of the Holocene Epoch.

Ice mass losses from 2002-2017 were estimated from gravity data obtained by the GRACE satellites.
The GRACE measurements upon which the accelerating ice loss claims are based are heavily dependent on the Glacial Isostatic Adjustment (GIA). While not as large as Antarctica (where the GIA’s margin of error is nearly as large as the asserted ice loss), GIA variations can result in totally different ice loss values… And the GRACE time series isn’t any longer than the MODIS time series.
Wu et al., 2010 determined that the GIA commonly assumed for Greenland was way too high and that the 2002-2008 ice loss rate was 104 Gt/yr rather than the oft cited 230 Gt/yr. Even at 230 Gt/yr, it would take 1,000 years for Greenland to lose 5% of its ice mass.
Riva et al., 2007 concluded that the ice mass-loss rate in Antarctica from 2002-2007 could have been anywhere from zero-point-zero Gt/yr up to 120 Gt/yr. Dr. Riva recently co-authored a paper in GRL (Thomas et al., 2011) which concluded that GPS observations suggest “that modeled or empirical GIA uplift signals are often over-estimated” and that “the spatial pattern of secular ice mass change derived from Gravity Recovery and Climate Experiment (GRACE) data and GIA models may be unreliable, and that several recent secular Antarctic ice mass loss estimates are systematically biased, mainly too high.”
So… We have barely 15 years worth of data and no idea if the recent mass losses are anomalous relative to the early 20th century Arctic warming, Medieval Warm Period or any of the other millennial-scale Holocene warming periods.
In 2017 the Greenland ice sheet appeared to have gained mass. The GRACE mission ended in 2017; so we don’t know what it’s done since then
The ice mass estimates ostensibly take into account:
- Mass lost to iceberg calving.
- Surface Mass Balance (SMB).
The “funny” thing is that icebergs have a tough time calving if outlet glaciers aren’t advancing toward the sea. Glacial “dropstones” are geological evidence of past “ice house” climates. Dropstones are boulders and large rocks that are carried out to sea by icebergs. When the icebergs melt, the boulders drop to the bottom of the ocean. Increased calving of icebergs is evidence for colder climates from “Snowball Earth” right up until Al Gore invented Gorebal Warming.
SMB is the net difference of snow accumulation and ablation. The Greenland Ice Sheet has had positive SMB (gained ice) over the last 4 years. More snow has accumulated than ice has melted.
Here’s another odd thing about Greenland:

Greenland’s summer snow cover has increased since 1967. The winter snow cover can’t increase very much. It’s usually close to 100%.
Now on to Steve Mosher
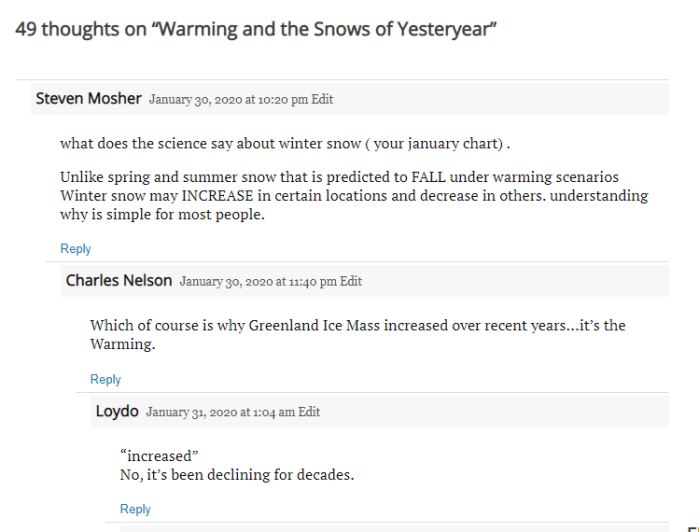
Steven Mosher January 30, 2020 at 10:20 pm Edit
what does the science say about winter snow ( your january chart) .
Unlike spring and summer snow that is predicted to FALL under warming scenarios
Winter snow may INCREASE in certain locations and decrease in others. understanding why is simple for most people.
Whatever the snow does, it will have been predicted by the climate models? Or did I read that wrong?
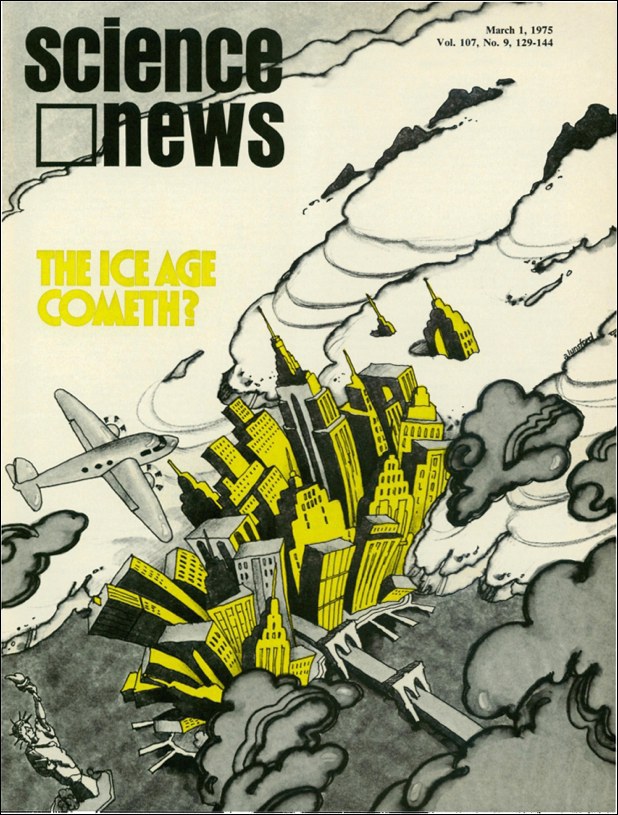
Let’s look at what Northern Hemisphere snow has been up to since “The Ice Age Cometh?”

It does appear that for the Northern Hemisphere, as a whole, it was a little snowier from 1972-1988 than it has been since then. However, the snow cover in 2019 was the same as it was when “The Ice Age Cometh?” Although it does seem that Leonard Nimoy went In Search Of “The Next Ice Age” at just the right time. 1978 was one of the snowiest years in Connecticut that I can remember. Regarding a meaningful trend, can you say: R² = 0.0604?
Now let’s break it down.
The GSL provides weekly and monthly data sets for various Northern Hemisphere regions:
I downloaded the monthly data sets for N. Hemisphere, N. America and N. America (no Greenland). I calculated the Greenland snow cover using this equation:
- N. America – N. America (no Greenland) = Greenland
In the graphs to follow, North America includes Greenland. North America is a subset of Northern Hemisphere and Greenland is a subset of North America.
It appears that Mr. Wrightstone was correct about winter.

Now let’s look at spring, month by month.


May starts to get interesting.

Bear in mind that back when we had some snowy months of May, it was right in the middle of That 70’s Climate Crisis Show…
Hey! Who else had this album back in the 70’s?
Well, apparently the August nights weren’t all that hot in 1972.

Steve didn’t tell us what the climate models predicted about the fall… I’m gonna guess that the models must have predicted more snowfall.

Let’s just be thankful for the climate models. They literally saved New York City from being bulldozed by a rampaging horde of godless glaciers.

According to the sacred climate models, if not for The Climate Wrecking Industry, the planet would be colder than “The Ice Age Cometh”…
This proud petroleum geologist says, “You’re welcome.”
via Watts Up With That?
January 31, 2020 at 08:05PM
