Month: February 2020

Summary Of UK Air Pollutants – 2018

By Paul Homewood


h/t Joe Public


 image

https://www.gov.uk/government/publications/emissions-of-air-pollutants/emissions-of-air-pollutants-in-the-uk-1970-to-2018-summary


The government has published the latest summary of air pollution.

Emissions of nitrogen oxides and sulphur dioxide continue to fall rapidly, but PMs have levelled off:

Trends in annual emissions, 1970-2018

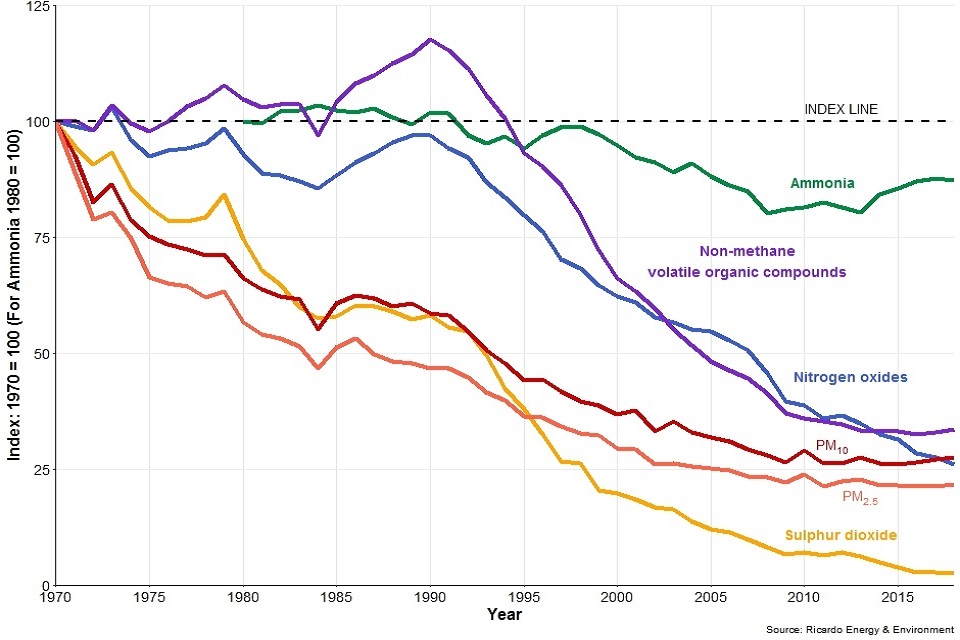
There has been a long term decrease in the emissions of all of the air pollutants covered by this statistical release (ammonia, nitrogen oxides, non-methane volatile organic compounds, particulate matter (PM10, PM2.5) and sulphur dioxide). The UK has met current international ceilings for emissions of air pollutants since they were introduced in 2010. The 2010 emissions total for nitrogen oxides exceeded the emissions ceilings, but the UK was allowed to apply an adjustment to the national total which brought the adjusted total under the emissions ceiling. Adjustments are allowed where non-compliance with the ceilings results from applying improved emission inventory methods updated in accordance with scientific knowledge. Compliance with national ceilings is then assessed by reference to the adjusted totals.

A large number of factors are responsible for the long-term decrease in emissions of air pollutants:

  • The reduction in use of coal for domestic heating and power generation has been a major factor in reducing emissions of particulate matter, although burning of other solid fuels for domestic heating and industry has increased in recent years.

  • The move away from using coal to gas for power generation and fitting flue gas desulphurisation equipment to existing coal-fired power stations has been responsible for long-term decreases in emissions of sulphur dioxide and nitrogen oxides.

  • Stricter emissions regulation for road transport has also led to significant emissions reductions for nitrogen oxides and non-methane volatile organic compounds (NMVOCs).

  • Stricter emissions limits placed on industry has significantly reduced emissions from solvents, which particularly affected emissions of NMVOCs.

  • Emissions of ammonia were largely influenced by changes to herd sizes and farming practices, as emissions from agriculture form a large majority of emissions of ammonia.

4. Recent trends in emissions of air pollutants

Trends in annual emissions of particulate matter (PM10 and PM2.5), nitrogen oxides, ammonia, non-methane volatile organic compounds, and sulphur dioxide, 2008-2018

Trends in annual emissions, 2008-2018

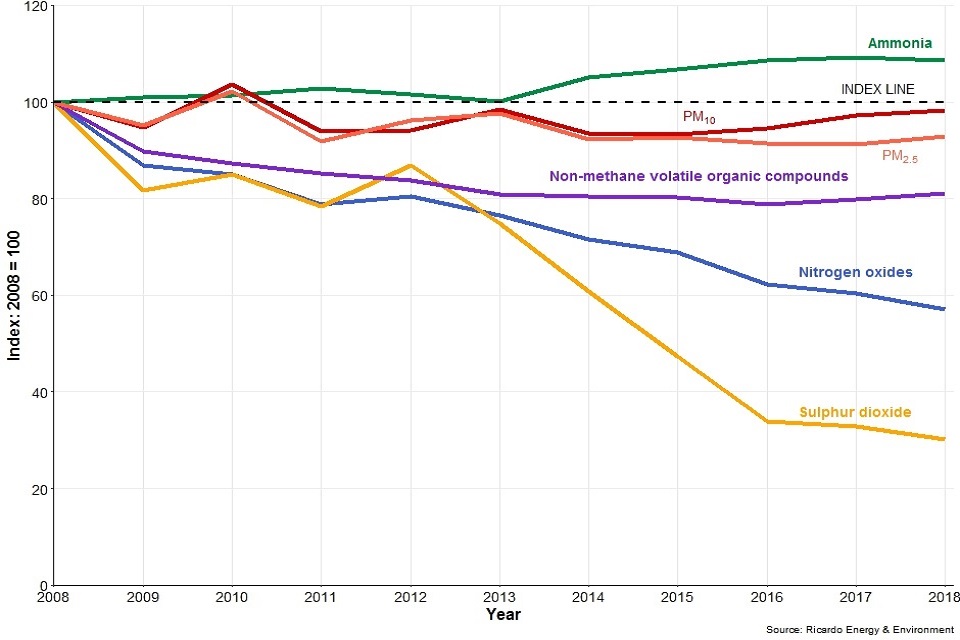
In the most recent ten-year period of emissions estimates, there has been mixed progress in reducing emissions of air pollutants:

  • For sulphur dioxide and nitrogen oxides, emissions have continued to fall in line with the long-term trend with much of the reduction as a result of the decreasing dependence on coal for energy generation (emissions of sulphur dioxide and nitrogen oxides from energy industries has fallen by 83 and 57 per cent respectively between 2008 and 2018).

  • Emissions of nitrogen oxides and non-methane volatile organic compounds from road transport also decreased by 47 per cent and 77 per cent respectively between 2008 and 2018. This is largely as a result of tighter emissions standards being introduced for petrol and diesel cars.

  • For particulate matter decreases in emissions from many sources have been partially offset by increases in emissions from residential burning (domestic combustion; emissions of PM2.5 from this source increased by 33 per cent between 2008 and 2018). This reflects the increasing popularity of solid fuel appliances in the home such as wood-burning stoves.

  • Emissions of non-methane volatile organic compounds have changed little since 2008 across most sources, and annual emissions of ammonia increased by 8.7 per cent between 2008 and 2018. This is largely due to increased fertiliser spreading.

    With emissions falling rapidly, the case for banning petrol/diesel cars for pollution reasons becomes ever weaker.

via NOT A LOT OF PEOPLE KNOW THAT

https://ift.tt/39gAHSA

February 27, 2020 at 04:55AM

Polar Bear Scientists May Be Hiding Good News

London, 27 February: A prominent Canadian zoologist has suggested that scientists may be hiding a spate of good news on polar bears.

In State of the Polar Bear Report 2019, published by the Global Warming Policy Foundation (GWPF) on International Polar Bear Day, Dr Susan Crockford explains publication of population counts for several Arctic regions have been long overdue.

Data on the body condition of female bears and survival of cubs in Western Hudson Bay have not been published in over 25 years, despite claims that these are key measures of the impact of climate change on bears.
 
According to Dr Crockford, this may well be because the data do not support claims of disaster for the bears.

Dr Crockford also says that sea ice conditions for Western and Southern Hudson Bay bears have been excellent in recent years.

“It can hardly be claimed that lack of sea ice is causing Western and Southern Hudson Bay polar bear numbers to decline as a result of poor cub survival and reduced weights of adult females when breakup and freeze-up dates have been so advantageous for the last three years,” Dr Crockford said.

The report also looks at recent incidents when two Russian Arctic towns were visited by polar bears, and suggestions that 2019 was the year of the polar bear ‘invasion’. The lives of local residents were certainly threatened by the congregations of bears, which numbered more than 50.

And as Dr Crockford explains, such large congregations of polar bears are likely to be an on-going problem because there are now so many polar bears roaming the Arctic and because virtually all communities still have open garbage dumps:

There is no evidence these 2019 ‘invasion’ incidents were caused by a local lack of sea ice or because the polar bears were starving. Right now, Arctic residents and visitors face a much greater risk of having a deadly encounter with a polar bear at almost any time of year than they did decades ago because polar bear populations are so much larger.

“Predictions of future calamity do not change the present reality that polar bears are abundant and thriving,” Dr Crockford said.
 
Key Findings
 
•  Reports have yet to be published for polar bear population surveys of M’Clintock Channel and Viscount Melville (completed 2016 and 2014, respectively), Southern Beaufort and Gulf of Boothia (completed 2017) and Davis Strait (completed 2018), yet several were promised for 2019 or sooner.

•  At present, the official IUCN Red List global population estimate (2015) is 22,000–31,000 (average about 26,000), but surveys conducted since then might raise the average to about 29,500.

•  Despite having to deal with changes in summer sea ice habitat greater than all other Arctic regions, according to Norwegian biologists polar bears in the Svalbard area of the Barents Sea showed few negative impacts from the low sea ice years of 2016 through 2019.

•  Despite repeated claims that the Southern Beaufort subpopulation is declining and nutritionally stressed, a summer survey of the coast of Alaska in 2019 documented 31 fat healthy polar bears onshore in July compared to only three in 2017, when sea ice retreat had been similarly early.

•  In 2019, and contrary to expectations, freeze-up of sea ice on Western Hudson Bay came as early in the autumn as it did in the 1980s (for the third year in a row); sea ice breakup in spring was like the 1980s too, with the result that polar bears onshore were in excellent condition.

•  If the public are to take seriously repeated claims of harm to polar bear health and survival due to climate change, data collected since 2004 on cub survival and weights of female polar bears in Western Hudson Bay must be made available: it has now been more than 25 years since data has been published on cub survival and weights of female polar bears in Western Hudson Bay but polar bear specialists continue to cite decades-old data to support their statements that lack of sea ice is causing declines in body condition and population size.

•  Since polar bear researchers acknowledge that there has been no negative trend in either freeze-up or breakup dates for sea ice in Western Hudson Bay since at least 2001, the failure to report current data on cub survival and weights of female bears suggests that body condition and cub survival have not declined over the last two decades as claimed.

•  Two separate incidents at opposite ends of the Russian Arctic at the beginning and the end of 2019 made this the year of the polar bear ‘invasion’. Belushya Guba in the Barents Sea over the winter of 2018/2019 and Ryrkaypiy, Chukotka in December 2019 were each besieged by more than 50 bears, which terrified local residents. Although tragedy was ultimately averted, this is likely to be an on-going problem for Arctic settlements in the future: not because there is not enough sea ice but because there are now so many polar bears roaming Arctic coastlines.

State of the Polar Bear Report 2019 (pdf)

The post Polar Bear Scientists May Be Hiding Good News appeared first on The Global Warming Policy Forum (GWPF).

via The Global Warming Policy Forum (GWPF)

https://ift.tt/3a8z5KN

February 27, 2020 at 04:09AM

Digging into the far side of the moon: Chang’E-4 probes 40 meters into lunar surface

Chinese Academy of Sciences Headquarters

225288_web225288_web

 The subsurface stratigraphy seen by Yutu-2 radar on the farside of the moon.

Credit: CLEP/CRAS/NAOC

A little over a year after landing, China’s spacecraft Chang’E-4 is continuing to unveil secrets from the far side of the Moon. The latest study, published on Feb.26 in Science Advances, reveals what lurks below the surface.

Chang’E-4 (CE-4) landed on the eastern floor of the Van Kármán crater, near the Moon’s south pole, on Jan. 3, 2019. The spacecraft immediately deployed its Yutu-2 rover, which uses Lunar Penetrating Radar (LPR) to investigate the underground it roams.

“We found that the signal penetration at the CE-4 site is much greater than that measured by the previous spacecraft, Chang’E-3, at its near-side landing site,” said paper author LI Chunlai, a research professor and deputy director-general of the National Astronomical Observatories of the Chinese Academy of Sciences (NAOC). “The subsurface at the CE-4 landing site is much more transparent to radio waves, and this qualitative observation suggests a totally different geological context for the two landing sites.”

LI and his team used the LPR to send radio signals deep into the surface of the moon, reaching a depth of 40 meters by the high frequency channel of 500 MHz – more than three times the depth previously reached by CE-3. This data allowed the researchers to develop an approximate image of the subsurface stratigraphy.

“Despite the good quality of the radar image along the rover route at the distance of about 106 meters, the complexity of the spatial distribution and shape of the radar features make identification of the geological structures and events that generated such features quite difficult,” said SU Yan, a corresponding author who is also affiliated with NAOC.

The researchers combined the radar image with tomographic data and quantitative analysis of the subsurface. They concluded that the subsurface is essentially made by highly porous granular materials embedding boulders of different sizes. The content is likely the result of a turbulent early galaxy, when meteors and other space debris frequently struck the Moon. The impact site would eject material to other areas, creating a cratered surface atop a subsurface with varying layers.

The results of the radar data collected by the LPR during the first 2 days of lunar operation provide the first electromagnetic image of the far side subsurface structure and the first ‘ground truth’ of the stratigraphic architecture of an ejecta deposit.

“The results illustrate, in an unprecedented way, the spatial distribution of the different products that contribute to from the ejecta sequence and their geometrical characteristics,” LI said, referring to the material ejected at each impact. “This work shows the extensive use of the LPR could greatly improve our understanding of the history of lunar impact and volcanism and could shed new light on the comprehension of the geological evolution of the Moon’s far side.”

###

This work was a collaboration with the Key Laboratory of Lunar and Deep Space Exploration at NAOC, the University of the Chinese Academy of Sciences, the Mathematics and Physics Department of Roma Tre University in Italy, the School of Atmospheric Sciences at the Sun Yat-sen University, and the Insituto per il Rilevamento Elettromagnetico dell’Ambiente IREA-CNR in Italy.

From EurekAlert!

via Watts Up With That?

https://ift.tt/394vs8J

February 27, 2020 at 04:06AM

US Gas Crushes Wind and Solar

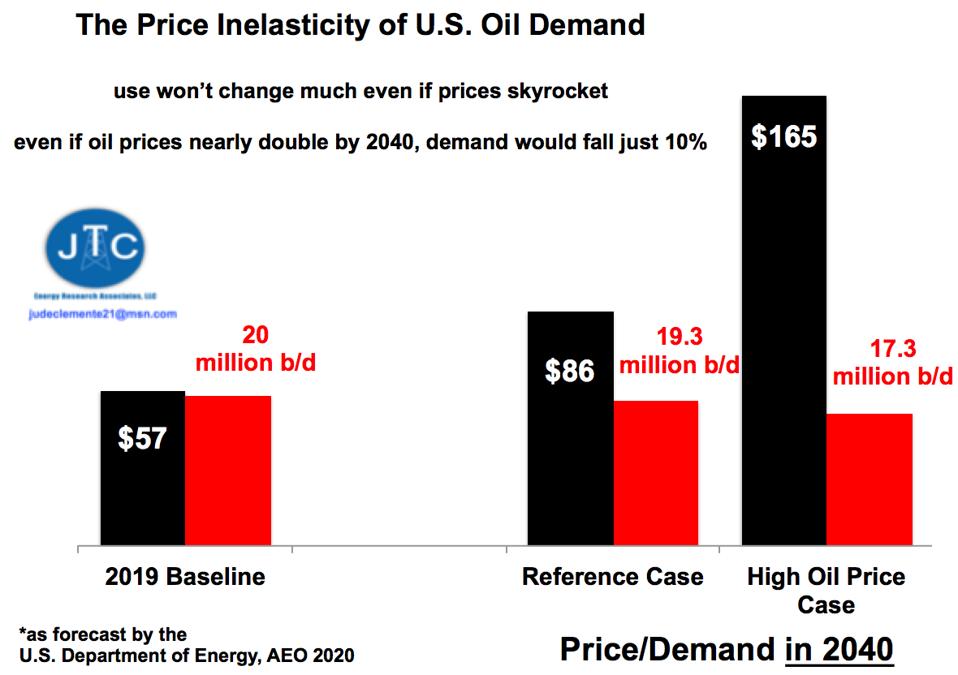
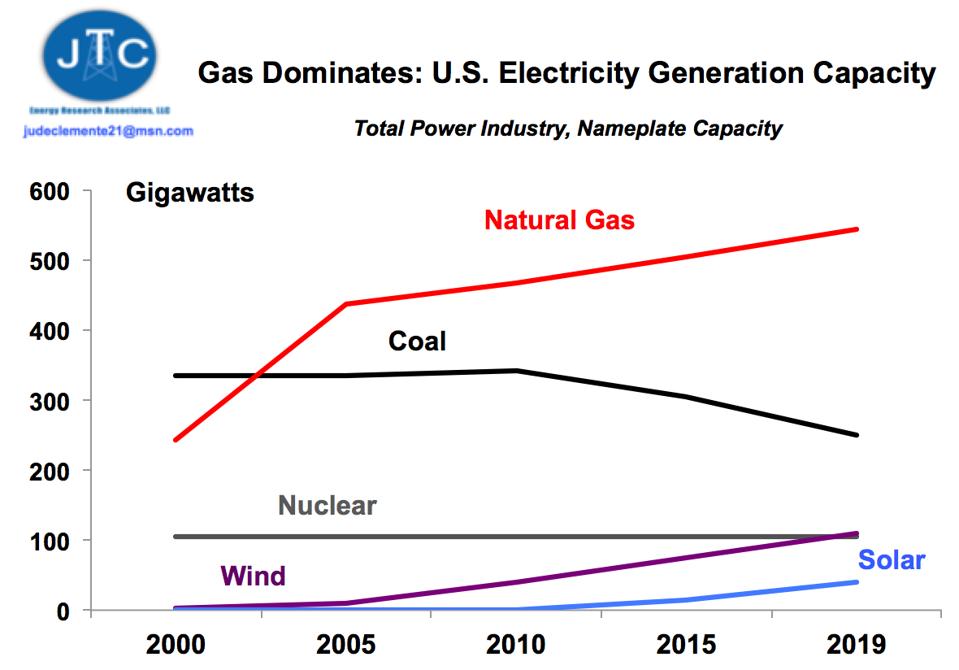
Jude Clemente reports at Forbes The Obvious Reality Of More U.S. Oil And Natural Gas
Excerpts in italics with my bolds.

Natural gas overwhelmingly dominates the U.S. electric power system, double second place coal. Gas is cleaner, cheaper, more flexible, and more reliable. Gas will supply over 40% of our power this summer and is racing toward being 50% of total generation capacity. Just think about the scale of that. For every 10o power plants in America that create electricity, 50 of them will run on natural gas (see Figure above). Further, the International Energy Agency has specifically credited the rise of gas in our power system as the reason why we are slashing CO2 emissions faster than any other country ever.

Understanding this reality, we must continue to resist growing “energy unrealism.” More bluntly, a fracking ban would be the worst policy for American economic, energy, and environmental security ever “nightmared” possible. Fracking accounts for some 80% of U.S. gas production and will represent almost all of incremental domestic supply.

So why do some presidential candidates want to slash $7.1 trillion and 19 million jobs from the U.S. economy from 2021 to 2025?

Indeed, the “shoot yourself in the foot” energy policies of California, New York, and the New England states cannot be allowed to go national. Even though gas is their primary source of electricity, these states have installed anti-production and anti-pipeline policies. Thus, their power prices are 50% or more above the national average and they are addicted to energy imported from other states. Massachusetts has been forced to import natural gas by ship from Russia over the previous two winters.

Too illustrate, like too often eating out at an expensive restaurant, California in some years has been importing a staggering 95% of its gas and 33% of its electricity. Talk about unsustainable. As we saw with the 2018 “Yellow Vest” riots in Paris against carbon taxes, Americans will not stand for such purposely installed expensive energy.

As fracking is set to make the U.S. the world’s largest oil and gas exporter, “Fiona Hill educates Democrats: Fracking hurts Putin.”

Further, fracking has soared U.S. crude oil production 160% to over 13 million b/d since 2008. This is a huge deal since oil remains our most vital source of energy, lacking any material substitute whatsoever. The U.S. Department of Energy has consistently modeled this to be true: since oil is an inelastic good, even drastic rises in pricing have little impact on demand (see Figure below).

This is hardly a surprise since overly expensive electric cars still account for just 1-2% of annual U.S. passenger car purchases. No kidding. The average Tesla buyer makes $400,000 a year – seven times the national average. Quietly even worse, “Taxpayer subsidies for electric vehicles only help the wealthy,” and “The U.S. Should Ban All Electric Cars in the Interest of National Security.”

The oil industry knows that it must tread lightly these days but is also wisely banking on oil as the ultimate indispensable product: “oil cannot not be used.” As for oil’s much reported on “social license to operate,” a reality check: “Exxon Isn’t the Oil User. You Are.”

For our own supply, fracking accounts for some 80% of U.S. oil production, and fracking will yield basically all new output for decades to come. The U.S. Department of Energy reports that fracking has the potential to skyrocket U.S. crude output another 50% or so to nearly 20 million b/d.

Indeed, OPEC’s and Vladimir Putin’s worst nightmare come true.

Figure 12: Figure 9 with Y-scale expanded to 100% and thermal generation included, illustrating the magnitude of the problem the G20 countries still face in decarbonizing their energy sectors. (Thermal refers to energy from oil, gas and coal.)

See Also  What If the US Banned Fracking?

Climateers Tilting at Windmills


via Science Matters

https://ift.tt/32uDo0x

February 27, 2020 at 03:39AM