
New Video : Permanent Drought Update
via Real Climate Science
February 25, 2020 at 12:34PM
via Real Climate Science
February 25, 2020 at 12:34PM
By Die kalte Sonne
[German text translated by P. Gosselin]
Many glaciers are currently shrinking, as they have always done in the past when the climate warmed up. What’s the news on the glacier front?
In August 2019, the Okjokull Glacier disappeared in Iceland with great media attention. The BBC reported:
Climate change: Iceland holds funeral for melted glacier
The glacier called Okjokull, is the first in the country to be lost to climate change, after the warmest July ever on record. Iceland loses about 11 billion tonnes of ice per year, and scientists have warned that there are about 400 other glaciers also at risk. They fear all of the island’s glaciers will be gone by 2200. Glaciers cover about 11% of Iceland’s surface.”
Read more at the BBC.
However, the glacier had not formed until the Little Ice Age. See our article “The cycle is full: death of an Icelandic glacier that did not exist even during the Medieval Warm Period“. Iceland’s prime minister from 2013-2016, David Gunnlaugsson, dislikes activism. In The Spectator, Gunnlaugsson wrote on November 23, 2019:
Iceland’s melting glaciers are nothing to panic about
It is a spectacle we have witnessed since the country’s first settlers arrived in the ninth century […] My home country is a young country; it was first settled just over 1,000 years ago. As a result, it offers unique insight into the relationship between man and nature, albeit not in the way commonly presented in the media. Take Iceland’s melting glaciers. Troubling as a calving glacier might seem, such a phenomenon is by no means out of the ordinary. In fact, this process defines a glacier: they move. Glaciers shed ice at their edges as ice builds up closer to the centre. It is a spectacle we have witnessed in Iceland since the first settlers arrived in the ninth century. […] In 1901, it measured 38 sq km in size; in 1978, it was just three sq km. So the glacier that had its last rites read in August had, in fact, more or less disappeared half a century ago. That might still seem to be a sad fate for a glacier that had only reached the age of 700. But some of Iceland’s glaciers are now considerably larger than when the country was first settled over a millennia ago. Iceland’s glaciers reached their peak around 1890. When the glaciers were expanding, laying waste to what had previously been green meadows and farmlands, the people who lost their homes would hardly have been grief-stricken by the thought that one day that trend might be reversed.”
Read more at The Spectator
Next we move on to the Alps. There man-made soot has contributed to the melting of the glaciers. However, the Alpine glaciers began to melt even before the massive influx of soot, Sigl et al. found in 2018. Soot influx did not begin until around 1875, when 80% of the glacier melt of the 19th century had already been completed. Abstract:
19th century glacier retreat in the Alps preceded the emergence of industrial black carbon deposition on high-alpine glaciers
Light absorbing aerosols in the atmosphere and cryosphere play an important role in the climate system. Their presence in ambient air and snow changes the radiative properties of these systems, thus contributing to increased atmospheric warming and snowmelt. High spatio-temporal variability of aerosol concentrations and a shortage of long-term observations contribute to large uncertainties in properly assigning the climate effects of aerosols through time.
Starting around AD 1860, many glaciers in the European Alps began to retreat from their maximum mid-19th century terminus positions, thereby visualizing the end of the Little Ice Age in Europe. Radiative forcing by increasing deposition of industrial black carbon to snow has been suggested as the main driver of the abrupt glacier retreats in the Alps. The basis for this hypothesis was model simulations using elemental carbon concentrations at low temporal resolution from two ice cores in the Alps.
Here we present sub-annually resolved concentration records of refractory black carbon (rBC; using soot photometry) as well as distinctive tracers for mineral dust, biomass burning and industrial pollution from the Colle Gnifetti ice core in the Alps from AD 1741 to 2015. These records allow precise assessment of a potential relation between the timing of observed acceleration of glacier melt in the mid-19th century with an increase of rBC deposition on the glacier caused by the industrialization of Western Europe. Our study reveals that in AD 1875, the time when rBC ice-core concentrations started to significantly increase, the majority of Alpine glaciers had already experienced more than 80 % of their total 19th century length reduction, casting doubt on a leading role for soot in terminating of the Little Ice Age. Attribution of glacial retreat requires expansion of the spatial network and sampling density of high alpine ice cores to balance potential biasing effects arising from transport, deposition, and snow conservation in individual ice-core records.”
Also a glacier history of the Alps since the end of the last ice age was published in 2009 by Susan Ivy-Ochs and colleagues. Between 10,500-3300 years before today, glaciers were mostly smaller than today and ended 200 meters above modern levels. The Alpine glaciers expanded during the cold period of migration and the Little Ice Age.
Want to know more about glacier history? Here’s the abstract:
Latest Pleistocene and Holocene glacier variations in the European Alps
In the Alps, climatic conditions reflected in glacier and rock glacier activity in the earliest Holocene show a strong affinity to conditions in the latest Pleistocene (Younger Dryas). Glacier advances in the Alps related to Younger Dryas cooling led to the deposition of Egesen stadial moraines. Egesen stadial moraines can be divided into three or in some cases even more phases (sub-stadials). Moraines of the earliest and most extended advance, the Egesen maximum, stabilized at 12.2 ± 1.0 ka based on 10Be exposure dating at the Schönferwall (Tyrol, Austria) and the Julier Pass-outer moraine (Switzerland). Final stabilization of moraines at the end of the Egesen stadial was at 11.3 ± 0.9 ka as shown by 10Be data from four sites across the Alps. From west to east the sites are Piano del Praiet (northwestern Italy), Grosser Aletschgletscher (central Switzerland), Julier Pass-inner moraine (eastern Switzerland), and Val Viola (northeastern Italy). There is excellent agreement of the 10Be ages from the four sites. In the earliest Holocene, glaciers in the northernmost mountain ranges advanced at around 10.8 ± 1.1 ka as shown by 10Be data from the Kartell site (northern Tyrol, Austria). In more sheltered, drier regions rock glacier activity dominated as shown, for example, at Julier Pass and Larstig valley (Tyrol, Austria). New 10Be dates presented here for two rock glaciers in Larstig valley indicate final stabilization no later than 10.5 ± 0.8 ka. Based on this data, we conclude the earliest Holocene (between 11.6 and about 10.5 ka) was still strongly affected by the cold climatic conditions of the Younger Dryas and the Preboreal oscillation, with the intervening warming phase having had the effect of rapid downwasting of Egesen glaciers. At or slightly before 10.5 ka rapid shrinkage of glaciers to a size smaller than their late 20th century size reflects markedly warmer and possibly also drier climate. Between about 10.5 ka and 3.3 ka conditions in the Alps were not conducive to significant glacier expansion except possibly during rare brief intervals. Past tree-line data from Kaunertal (Tyrol, Austria) in concert with radiocarbon and dendrochronologically dated wood fragments found recently in the glacier forefields in both the Swiss and Austrian Alps points to long periods during the Holocene when glaciers were smaller than they were during the late 20th century. Equilibrium line altitudes (ELA) were about 200 m higher than they are today and about 300 m higher in comparison to Little Ice Age (LIA) ELAs. The Larstig rock glacier site we dated with 10Be is the type area for a postulated mid-Holocene cold period called the Larstig oscillation (presumed age about 7.0 ka). Our data point to final stabilization of those rock glaciers in the earliest Holocene and not in the middle Holocene. The combined data indicate there was no time window in the middle Holocene long enough for rock glaciers of the size and at the elevation of the Larstig site to have formed. During the short infrequent cold oscillations between 10.5 and 3.3 ka small glaciers (less than several km2) may have advanced to close to their LIA dimensions. Overall, the cold periods were just too short for large glaciers to advance. After 3.3 ka, climate conditions became generally colder and warm periods were brief and less frequent. Large glaciers (for example Grosser Aletschgletscher) advanced markedly at 3.0–2.6 ka, around 600 AD and during the LIA. Glaciers in the Alps attained their LIA maximum extents in the 14th, 17th, and 19th centuries, with most reaching their greatest LIA extent in the final 1850/1860 AD advance.”
Hormes et al. 2006 also dealt with Holocene glacier history, namely in the Swiss Alps. Several times the Swiss Alpine glaciers were smaller than today, each for 320-2500 years. The authors see a relationship between glacial changes and solar activity. Abstract:
A geochronological approach to understanding the role of solar activity on Holocene glacier length variability in the Swiss Alps
We present a radiocarbon data set of 71 samples of wood and peat material that melted out or sheared out from underneath eight presentday mid‐latitude glaciers in the Central Swiss Alps. Results indicated that in the past several glaciers have been repeatedly less extensive than they were in the 1990s. The periods when glaciers had a smaller volume and shorter length persisted between 320 and 2500 years. This data set provides greater insight into glacier variability than previously possible, especially for the early and middle Holocene. The radiocarbon‐dated periods defined with less extensive glaciers coincide with periods of reduced radio‐production, pointing to a connection between solar activity and glacier melting processes. Measured long‐term series of glacier length variations show significant correlation with the total solar irradiance. Incoming solar irradiance and changing albedo can account for a direct forcing of the glacier mass balances. Long‐term investigations of atmospheric processes that are in interaction with changing solar activity are needed in order to understand the feedback mechanisms with glacier mass balances.”
On the mountains of the Gobi Desert in Mongolia, a mysterious glacier melt occurred during the last ice age, although it was quite cold. There was a lack of precipitation, according to the University of Washington.
The Lewis Glacier on Mt Kenya has been shrinking for the last 150 years. Again, a lack of moisture plays a role as Prinz et al. reported in 2016.
The Brewster Glacier in New Zealand has grown strongly over the last 40 years, documented by Sirguey et al. 2016, but since 2008 the glacier has been shrinking again. Scientists see a connection between glacier development and the PDO (Pacific Decade Oscillation). Abstract:
Reconstructing the mass balance of Brewster Glacier, New Zealand, using MODIS-derived glacier-wide albedo
In New Zealand, direct measurements of mass balance are sparse due to the inaccessibility of glaciers in the Southern Alps and the logistical difficulties associated with maintaining a mass balance record. In order to explore the benefit of remotely sensed imaging to monitor mass balance in the Southern Alps, this research assesses the relationship between measurements of glacier surface albedo derived from Moderate Resolution Imaging Spectroradiometer (MODIS) and mass balance observations using the glaciological method on Brewster Glacier over the 2005–2013 period. We confirm that minimum glacier-wide albedo is a reliable predictor for annual mass balance in this maritime environment (R2 = 0.93). Furthermore, we show that regular monitoring of glacier-wide albedo enables a new metric of winter accumulation to be derived, namely the cumulative winter albedo, which is found to correlate strongly with winter mass balance (R2 = 0.88), thus enabling the reconstruction of separate winter and summer mass balance records. This allows the mass balance record for Brewster Glacier to be extended back to the start of MODIS observations in 2000 and to confirm that the annual balance of Brewster Glacier is largely controlled by summer balance (R2 = 92 %). An application of the extended record is proposed whereby the relationship between mass balance and the photographic record of the end-of-summer snowline altitude is assessed. This allowed the annual balance record of Brewster Glacier to be reconstructed over the period 1977–2013, thus providing the longest record of mass balance for a glacier in New Zealand. Over the 37-year period, our results show that Brewster Glacier gained a significant mass of up to 14.5 ± 2.7 m w.e. by 2007. This gain was offset by a marked shift toward negative balances after 2008, yielding a loss of 5.1 ± 1.2 m w.e., or 35 % of the gain accumulated over the previous 30 years. The good correspondence between mass balance of Brewster Glacier and the phase of the Pacific (Inter-)Decadal Oscillation (PDO/IPO), associated with the fast terminus retreat observed between 1978 and 1998, strongly suggests that the observed mass gain of Brewster Glacier since 1977 is only offsetting a longer sequence of dominantly negative balances.”
Growing New Zealand glaciers were also described by Mackintosh et al. 2017. The cause was cool temperatures and not low precipitation. Abstract:
Regional cooling caused recent New Zealand glacier advances in a period of global warming
Glaciers experienced worldwide retreat during the twentieth and early twenty first centuries, and the negative trend in global glacier mass balance since the early 1990s is predominantly a response to anthropogenic climate warming. The exceptional terminus advance of some glaciers during recent global warming is thought to relate to locally specific climate conditions, such as increased precipitation. In New Zealand, at least 58 glaciers advanced between 1983 and 2008, and Franz Josef and Fox glaciers advanced nearly continuously during this time. Here we show that the glacier advance phase resulted predominantly from discrete periods of reduced air temperature, rather than increased precipitation. The lower temperatures were associated with anomalous southerly winds and low sea surface temperature in the Tasman Sea region. These conditions result from variability in the structure of the extratropical atmospheric circulation over the South Pacific. While this sequence of climate variability and its effect on New Zealand glaciers is unusual on a global scale, it remains consistent with a climate system that is being modified by humans.”
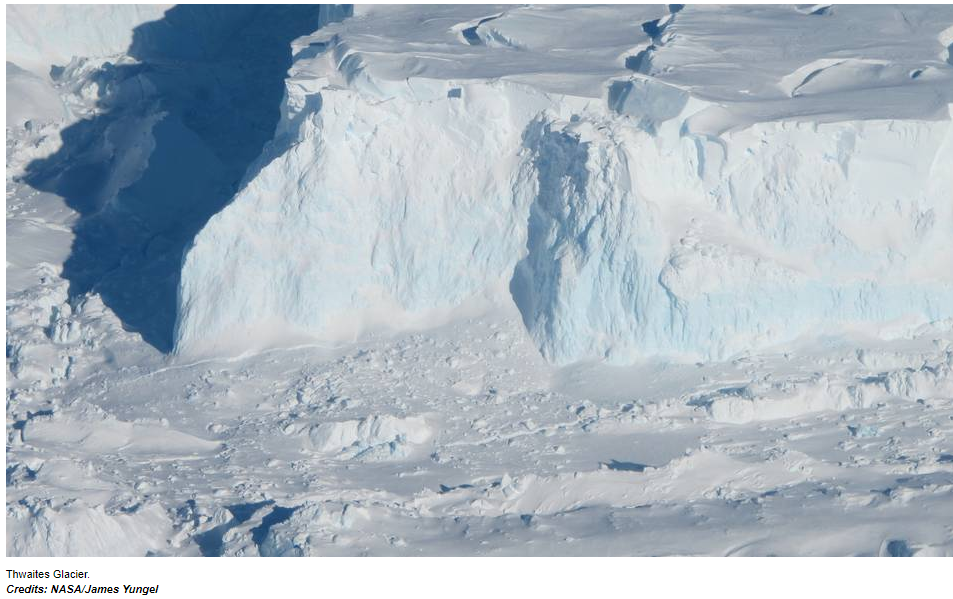
Finally, a reference to the melting Totten Glacier in the East Antarctic. This glacier is apparently shrinking due to strong winds that bring warm uplift water to the glacier. But of course, the wind changes are also said to be anthropogenic in origin. Of course, what else would it be!
via NoTricksZone
February 25, 2020 at 12:06PM
By Larry Kummer, Editor / 25 February 2020
Summary: Epidemics are like wars in that truth is the first casualty. I see comment threads in which misinformation makes most readers know less than when they started. Meanwhile, this blockbuster good news from China is lost amidst the chaff.

From WHO’s February 24 situation report.
Outside China, there are 29 nations infected (1 new, 6 since Feb 3). There are 1,374 cases (261 new, 1,221 since February 3). This does not include the 695 infected and then quarantined on the Diamond Princess.
Here are excerpts from remarks by Tedros Adhanom, Director-General of WHO, at the February 24 media briefing. This is important news – contradicting guesses by the doomsters.
“We’re encouraged by the continued decline in cases in China.. …They found that the epidemic peaked and plateaued between the 23rd of January and the 2nd of February, and has been declining steadily since then.
That is good news, and not just for China. With no preparation and relatively primitive public health networks (compared to those of developed nations), the epidemic stabilized in roughly four weeks – probably due to China’s fast and large quarantines. That is good news, because other nations are relying on quarantines to contain the infection.
Also, this suggests that the doomsters’ predictions that the epidemic would prove uncontrollable in China – sweepting through to its four corners – are wrong. China’s 77 thousand cases sounds like a large number, but it is a small fraction of China’s 1.4 billion people. That is true even if the true number infected is twice as large, or even (implausibly) five times as large.
“They found that the fatality rate is between 2% and 4% in Wuhan, and 0.7% outside Wuhan.”
The fatality rate in the developed nations will certainly be lower than that in China outside Wuhan (medical facilities in Wuhan are overwhelmed), although the estimate of a 0.7% fatality rate might be wrong. Original estimates were over 2% (e.g., here). If proven correct, this is great news.
“They found that for people with mild disease, recovery time is about two weeks, while people with severe or critical disease recover within three to six weeks.”
That is also important news, as the length of time required for treatment of critical cases determines how quickly an epidemic overloads the hospital facilities of a region.
The Director gives the bottom line about the status of the epidemic: it is not a pandemic, yet.
“The sudden increases of cases in Italy, the Islamic Republic of Iran and the Republic of Korea are deeply concerning. There’s a lot of speculation about whether these increases mean that this epidemic has now become a pandemic. We understand why people ask that question.
“WHO has already declared a Public Health Emergency of International Concern – our highest level of alarm – {on January 30} when there were less than 100 cases outside China, and 8 cases of human-to-human transmission.
“Our decision about whether to use the word “pandemic” to describe an epidemic is based on an ongoing assessment of the geographical spread of the virus, the severity of disease it causes and the impact it has on the whole of society.
“For the moment, we are not witnessing the uncontained global spread of this virus, and we are not witnessing large-scale severe disease or death. Does this virus have pandemic potential? Absolutely, it has. Are we there yet? From our assessment, not yet.”
See the WHO website for details about the meaning of “pandemic” (here and here).
The doomsters are multiplying faster than those infected with the diesase, spreading misinformation. They use graphs showing rapid growth in the small numbers of infected to make this seem like a major pandemic outside China. It’s not, at least yet.
They make bold statements about COVID-19 not justified by currrent research, especially comparing it to the flu. Most importantly, they assume developed nations will have the same rates of spread & mortality as China – despite our vastly better medical infrastructure.
Making this much worse is the same dynamic seen in the climate change debate: experts seeking their 15 minutes of fame by making statements (often quite wild) that are outside of the consensus, without mentioning that. In the early stages of the epidemic, there was pushback to this by other experts. Now, as in climate science, the pushback has stopped – encouaging more experts to fuel the hysteria for their own gain.
Epidemics are like wars in another respect: their outcomes are difficult to predict. But whatever happens, this is – as I said on January 25 – a historical milestone. The combination of global organization and high tech has allowed preparations during the past 54 days of an unprecedented speed and scale. Without these, by now we might be in the midst of a devastating global pandemic. This is progress.
But as usual, Trump wants to reduce our defenses to anything other than war. In the midst of the Coronavirus epidemic, President Trump proposed cutting funding to the World Health Organization by 53% and to the Pan American Health Organization by 75%. Madness.
The World Health Organization provides daily information, from highly technical information to news for the general public.
Ideas! For some shopping ideas, see my recommended books and films at Amazon. Also, see a story about our future: Ultra Violence: Tales from Venus.
Please like us on Facebook and follow us on Twitter. Also, see these posts about epidemics…
In these films, we see scientists behaving according to their and our highest ideals.
When Worlds Collide

Contagion (2011).
via Watts Up With That?
February 25, 2020 at 12:01PM
A series of Comments and Correspondence have recently been published in Nature Climate Change and the legacy alarmist media has gone into overdrive to spin the false narrative once again that climate change ’caused’ the devastating Australian bushfires. This is obviously very important to them; they simply must establish the link between the […]
via Climate Scepticism
February 25, 2020 at 11:30AM


