
By Paul Homewood
Joe Bastardi explains why this winter has been so mild in the US, but also across N Europe, at CFACT:

I want you to read this article:
Two points:
1) I will make the case for why such winters like this happen
2) I will point out that nowhere in this article did the massive natural physical drivers that far outweigh the effect of CO2, which is only .041% of the atmosphere. Pointedly, of which man is only responsible for 25% and the US only 15% of that total.
I am not going to waste time attacking here, except to say this kind of one-sided journalism and the fact that nowhere did anyone show what I am about to reveal to you, should raise questions of any objective person.
Basically the rules of the game are, if its warm like this winter, its climate change, if it is cold, its climate change. It is typical of everyone gets a trophy in that any answer even if opposite, means you get credit.
I won’t copy the whole article as it is a bit technical, but it can be seen here. However these are the main points Joe raises, starting with the role of El Nino and water vapour:
Water vapor is by far the most important greenhouse gas when it comes to the planetary weather and climate. Meteorologist look at “saturation mixing ratios” which show a correlation of water vapor to temperature. Basically the colder and drier the air mass, the more the introduction of water vapor will lead higher temperatures, there is no place like the arctic to prove this is the case. The cyclically warmed oceans have put more water vapor (and CO2) into the air. When Super El Niño’s go off, the immense amounts dispersed lead to a step up of the temperature. The colder regions leading the way as will be opined on below.
.png)
Now look at the table below. Notice how small the correlated increase of WV is between -40 and -30 ( less than .1gram/kg). The introduction of those slight amounts create clouds, cause lower pressure and more turbulent mixing. All of which act to increase temperatures where its very cold. (Also in the high levels of the atmosphere, which is why the “trapping hot spot theory of warming in the upper levels over the tropics has gone the opposite way. ITS DRYING OUT NOT GETTING MORE MOIST). While its true this creates a distortion in the global temperature pattern, this is inherent in the system anyway. Notice at higher temperatures it takes much more water vapor to correlate to the temperature increase.
.png)
So look at the warming in the arctic:
.png)
The warming is in the very cold time of the year which skews the overall temp upward. Missing from this are the actual arctic temps which will still be frigid but not as low as they were in the winters 30 years ago. Still, no one is going to survive an arctic winter unless as prepared as they would have been 30 years ago. BUT THERE IS NO SUMMER WARMING meaning the amount of water vapor from the cyclically warmed oceans has little effect where it is warmer, much more when it’s cold. The fact that no such correlation chart exists for CO2 and temps should make one understand the minute effect it has on temperature anyway.
This goes to the heart of recent global warming trends, so to repeat:
1) We are seeing a double step up in global temperatures, as a direct result of the two super El Ninos, in 1998 and 2016/16.
2) El Ninos affect global temperatures by putting massive amounts of water vapour into the atmosphere
3) This water vapour has a disproportionate effect in dry regions, notable the Arctic, one of the reasons why an average global temperature is a meaningless concept.
Joe then proceeds to explain how sea surface temperatures in both the Pacific and Atlantic have been the drivers for the the mild US winter in the east this year.
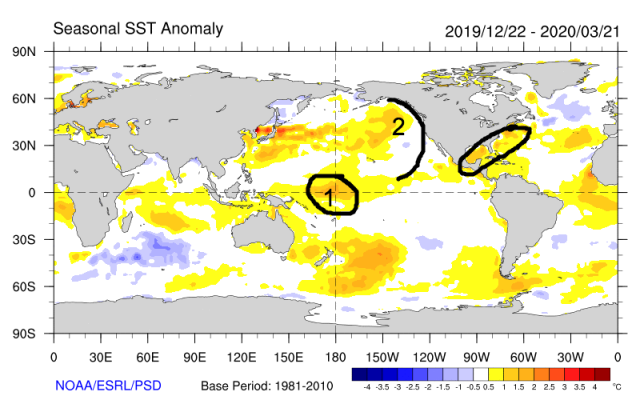
1) The warm water was near and west of the dateline. This is huge as I will explain later. 2) The water was cooler near and off the west coast than further west. 3) Warm water off the east coast, which we knew, but with no cold attacking, it was free to overtake the pattern at will.
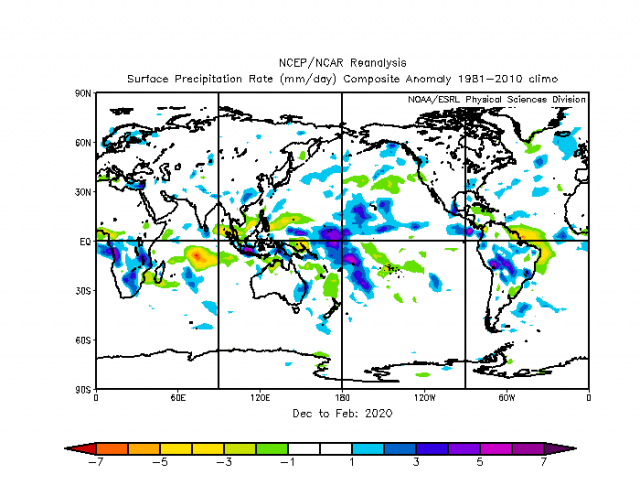
That warm water in area 1 favors enhanced thunderstorms and the release of heat in the upper levels in a way that changes the pattern in the Pacific. If we look at the Madden Julian Oscillation, we see that favors a phase 6. Notice where the heavy precipitation is in the winter in phase 6
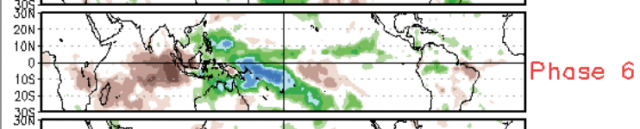
Look at this winter almost right on top of it.
What does a mean phase 6 give us for the US temperature-wise?
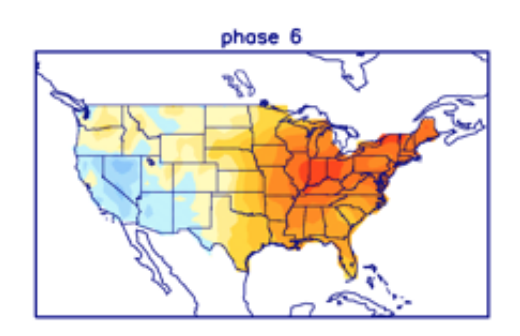
Guess what happened this winter, what phase 6 gives us. Now if this is CO2, why doesn’t it simply occur every winter? Because its not, its large scale natural forcing. Minute increases in CO2 are not going to push around the oceans, whose cycles are decades and in some cases even longer in the making.
But wait there is more. If we take the last 4 very warm winters 98-99, 2001-2002,2011-2012,2019-2020
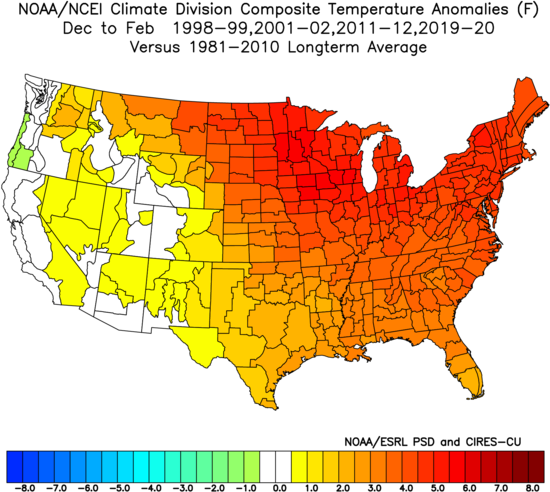
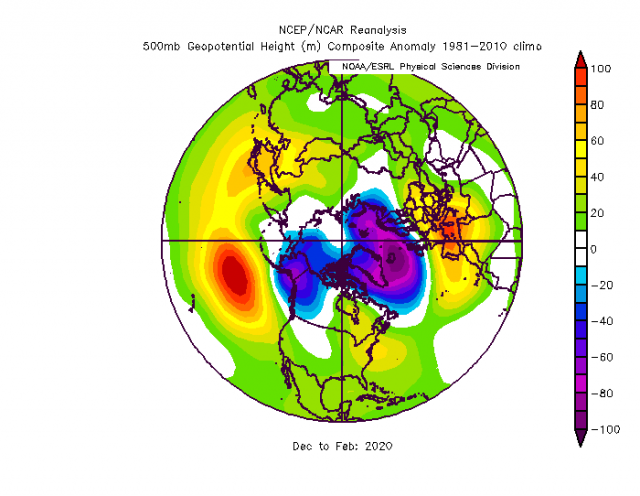
and looked at the upper air pattern, we notice a powerfully positive arctic oscillation (for the sake of ease, severe cold over the pole),
.png)
we see a positive eastern Pacific oscillation. Cold in Alaska, ridging north of Hawaii. This in turn forces ridging over the eastern US which is then fed by very warm water as it prevents cold intrusions, the ridging over Europe where it was quite warm and in much of Russia. What did we see this year?
Joe finishes by mapping out how small variations in the pattern of SSTs led to the snowmageddon in 2010.
It is a reminder that it is the oceans which drive our weather. As Joe puts it:
Minute increases in CO2 are not going to push around the oceans, whose cycles are decades and in some cases even longer in the making.
via NOT A LOT OF PEOPLE KNOW THAT
April 3, 2020 at 01:09PM
