

Now that Arctic ice peak has passed, the Pacific basins of Bering and Okhotsk take center stage, providing most of the open water reducing ice extents. The animation above shows in the last 3 weeks Bering on the right lost half of its ice, down from 820k km2 to 450k km2 yesterday. Meanwhile Okhotsk on the left declined from 1080k km2 to 650k km2. Those losses make up entirely the Arctic deficit to average at this time.
Background on Okhotsk Sea
NASA describes Okhotsk as a Sea and Ice Factory. Excerpts in italics with my bolds.
The Sea of Okhotsk is what oceanographers call a marginal sea: a region of a larger ocean basin that is partly enclosed by islands and peninsulas hugging a continental coast. With the Kamchatka Peninsula, the Kuril Islands, and Sakhalin Island partly sheltering the sea from the Pacific Ocean, and with prevailing, frigid northwesterly winds blowing out from Siberia, the sea is a winter ice factory and a year-round cloud factory.
The region is the lowest latitude (45 degrees at the southern end) where sea ice regularly forms. Ice cover varies from 50 to 90 percent each winter depending on the weather. Ice often persists for nearly six months, typically from October to March. Aside from the cold winds from the Russian interior, the prodigious flow of fresh water from the Amur River freshens the sea, making the surface less saline and more likely to freeze than other seas and bays.
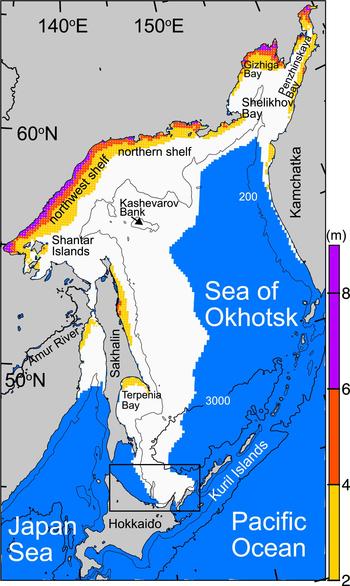
Map of the Sea of Okhotsk with bottom topography. The 200- and 3000-m isobars are indicated by thin and thick solid lines, respectively. A box denotes the enlarged portion in Figure 5. White shading indicates sea-ice area (ice concentration ⩾30%) in February averaged for 2003–11; blue shading indicates open ocean area. Ice concentration from AMSR-E is used. Color shadings indicate cumulative ice production in coastal polynyas during winter (December–March) averaged from the 2002/03 to 2009/10 seasons (modified from Nihashi and others, 2012, 2017). The amount is indicated by the bar scale. Source: Cambridge Core
Bering Sea Ice is Highly Variable

The animation above shows Bering Sea ice extents at April 2 from 2007 to 2020. The large fluctuation is evident, much ice in 2012 -13 and almost none in 2018, other years in between. Given the alarmist bias, it’s no surprise those two years are picked for comparison:


Taking a boat trip from Hokkaido Island to see Okhotsk drift ice is a big tourist attraction, as seen in the short video below. Al Gore had them worried back then, but not now.

via Science Matters
April 3, 2020 at 12:39PM
