
by Andy West
Explores the contrast between Allied and Core belief in the culture of climate catastrophe, and the relationships of these plus religiosity to Climate Change Activism (XR and Children’s Strikes for Climate). Post 2 of 3.
Introduction
The opening post of this series demonstrated a strong correlation across nations between religiosity, and the responses per nation to unconstrained questions from a 2019 YouGov survey on attitudes to climate-change, which questions are aligned to Catastrophic Climate Change Culture (CCCC). Chart 1 below was shown towards the end of the prior post. Y axis values show the percentage of ‘a great deal’ responses to two climate survey questions: “How much of an impact, if any, do you believe climate change will have on your life?” (blue series), and “how much power, if any, do you think each of the following have to combat climate change?” sub-option, “International bodies (e.g. the United Nations)” (pink series).

I term the effect causing these trends ‘Allied Belief’ (ABel). They occur because the surface alliance between CCCC and religion, makes religious adherents feel comfortable with climate catastrophe narratives, as long as there are no reality constraints, thereby disabling their Innate Skepticism of CCCC. As religiosity rises within nations (going left to right), ISk about CCCC narratives falls, and so belief in said narratives rises. The pink series is muted, as it’s only needed to show lower gradient for less emotive / existential / personal questions. Note: ISk is an instinctive mechanism that is very different to rational skepticism. [Chart is simplified Chart 2 in SI datafile].
Constrained Belief and Core Belief
So, if we think of what we might call ‘standard belief’ in a culture, especially strong expressions of this such as we’re very familiar with from ardent religious adherents, or indeed regarding the case in point, those similarly committed to catastrophic climate culture, how would that look on the above chart and how does it differ from ABel? We can start with the fact that adherence of this kind doesn’t primarily occur via alliance; it’s a direct commitment, essentially to core cultural narratives (from which we can label it Core Belief, CBel) and one that survives clashes with reality issues. So, now it’s time to look at reality-constrained survey questions.
The orange series in Chart 2 plots results from a reality-constrained question, in fact the enormous 2015 UN ‘My World’ poll having ~10 million participants from many nations. In this case, constraint arises from having to rank 6 global threats out of 17 as the most important, with one being ‘action on climate change’. Note: the orange scale, the percentage vote-share for action on climate change from this poll, is smaller than the blue. Nations correspond vertically; in this chart (and above too) Taiwan and Hong-Kong are dropped as the UN poll doesn’t cover them, leaving 22 nations. [Chart is Chart 2yxA in SI datafile].
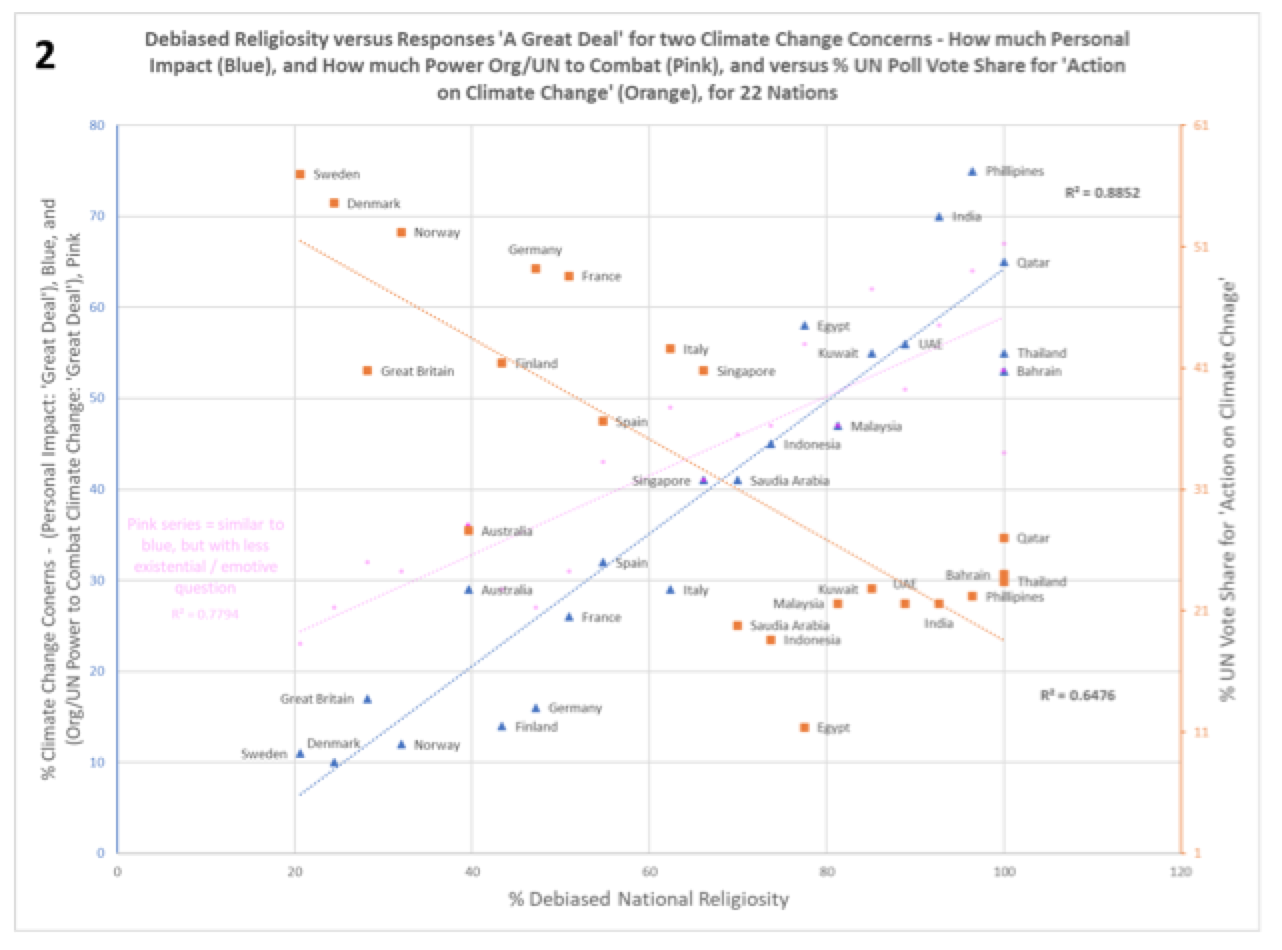
So, there’s apparent paradoxes here! Those nations expressing the highest concerns about climate-change (and inclusive of more faith in the UN to fix it), also express the lowest desire for ‘climate-change action’. And oppositely at the LHS. However, this fits fine with the underlying cultural mechanics. Also, it looks like there’s structure in the wide variability about the orange trend. Before saying more about these things though, we must continue to pursue CBel…
The orange series represents belief in a weakly-constrained circumstance (so I term that Constrained Belief, ConBel). There’s much variety in how surveys questions can constrain. For instance, even for commonly used issue lists: How many issues? How many to select out of them? Are they all genuinely felt concerns? How closely felt (e.g. national versus international, for the former, country relevant?). The SI (especially Footnote 4) provides detail. This will produce a range of constraint strengths. For a choice of X out of Y issues, constraint is stronger as X reduces relative to Y (so say, 1 out of 12 much stronger than 3 out of 12), commitment to the winning issue(s) has to be higher. National issues are stronger than global ones (closer to reality for most participants).
To find CBel, all we have to do is increase the constraint strength to ‘ultimate’ as it were. If people still believe in action on climate change above all other reality issues however strong, this indicates a direct belief in the narratives of catastrophe and salvation, which in their own terms and contrary to mainstream science, do outbid everything else. The snag is we can’t measure this, because there’s no survey with a consistent method of full constraint across many nations (that I’m aware of). But we can estimate it, and we can also box the estimate in via nearby measurements.
Hence I add a series (red) to Chart 2, which represents those still choosing climate-change in a strongly-constrained (but not fully) survey over 16 of the 22 nations (most I can get). And I add some spot-points for much smaller surveys on a few European nations (red crosses), that are fully constrained. This gives Chart 3 below, on which I also place an estimate of CBel (bold-orange). Note: for clarity only the trend of the red series is shown. The orange series above, on expanded RH Y axis, is also reduced to just its trend. [For full details, data, r/r2/p, survey-sources, see Chart 3yxA of datafile and Section 3 of expanded post].

A very straightforward estimate of CBel is obtained by dividing the UN Poll vote-share for action on climate-change (orange series in Chart 2) by 6; the reasonable assumption of evenly distributed votes on the selected issues means this is how many would have chosen that option as their top priority. While being asked to make that top single-choice directly is a different context, which may skew the estimate somewhat, it is below the red trend and with ~proportional gradient as we expect, plus the red actual measurements (crosses) at the LHS, do straddle the estimate. The latter hint the estimate is a little high there, however I take the bold-orange trend as my CBel going forward.
On a single chart we now have ABel (with muted-pink showing how it tracks when weaker), and CBel (equivalent to full strength ConBel, with muted-red plus orange showing how it tracks when weaker). It’s worth noting that as core believers will be affirmative to all climate-change issues / concerns, the ABel trends are actually inclusive of CBel too, albeit the latter is very much smaller across most of the chart.
ConBel / CBel underlying mechanism
So, back to that apparent paradox noted above. A reality-constraint has two effects on climate-change attitudes. Firstly, the issue is forced down to Earth so to speak, robbing a great deal of the emotive power in climate catastrophe narratives. At the same time, cost and consequence is introduced wrt all the other important issues that are needful in our societies, in turn challenging existing personal value-sets that are set within the context of those societies.
Although the UN poll constrains pretty weakly, the loss of emotive power / alignment to CCCC narrative is enough to dissolve the subconscious reassurance in religious folks that this cause is truly allied to their values, to their faith. Presumably, they don’t subconsciously feel the oft-proclaimed alliance any longer. Hence their ISk, which had been disabled by this reassurance, springs into action. As religious adherents have strongly focused cultural values to defend, which are now challenged by the societal consequences / costs, their ISk comes in big.
Real-world implications: Policy and Climate Activism
Subconsciously biased communicators for or against climate-change issues / support, can find comfort and claims at various places on Chart 3 trendlines. This increases confusion about what publics actually think, and cultures can take advantage of confusion. I’d be surprised though if communicators have any inkling about the global role of religiosity; no doubt they’ll see what they want to regarding motivations both ‘good’ and ‘bad’. However, a huge problem for CCCC adherents within irreligious nations, is that innate skepticism of any narratives that veer too much towards the existential / emotive, especially with any personal angle, is huge. Yet cultures don’t work rationally and propagate / amplify such narratives at every opportunity, turning off a big majority of people even as they also gain adherents. Similarly, any real-world strong constraint such as the sacrifice of petrol cars or gas heating, is likely only to achieve CBel levels of support at best. Though all trendlines change with time too (CCCC is growing) even the more modest sacrifices won’t likely get support beyond the strongly-constrained (red) trendline– if the real-world clashes are properly communicated / realized, which may not necessarily be the case.
[Note: the huge new reality-constraint of COVID-19 will highly likely squeeze the thick orange line down still further wrt other priorities; minimal fervent believers only, albeit this effect could evaporate after a year or two. Cultures are typically very robust to such damage, and may even find ways to turn adverse conditions into advantage longer-term].
This leads to enormous frustration for core believers within irreligious countries, but far less for those in religious countries where support will often seem very high (albeit being from ABel, it’s ephemeral). So regarding Climate Activism, we expect this to occur most in nations at the LHS of Chart 3, where core believers are defending their existential culture from the great majority of non-believers; and for cultures as for armies sometimes, attack (aggressive proselytization, civil disobedience) is a good form of defense. In very religious countries, there’s far less apparent need to rail against society, and less core believers to start with in order to maintain activism. So, we expect proportionally high activism at left, to low at right.
As explained in the SI, for any route attempting to demonstrate that climate activism conforms to this pattern, available data seems far-from-ideal. I went with the route of sampling Extinction Rebellion and Children’s Strike Weekly presence across nations, from their respective websites.
Extinction Rebellion conformance to expectation
I split the XR data into tiers, with Tier 3 the highest presence (>0.5 groups per million population), Tier 2 next lowest (>0.1 groups/M), Tier 1 non-zero, and Tier 0 with zero presence. [For how / why / details, see SI expanded post Section 5 and Footnote 6]. These Tiers mapped onto the main ABel / CBel trends in Chart 4 below, do show the highest XR presence Tier (dark-green) at the leftmost side, and the second-most presence Tier (mid-green) covering the next few nations to the left. Excepting Qatar, which happens to have 1 XR group and a very low population, a lucky T2-score. The XR presence for Tier 1 is far lower, figures in pale green show fractions of the presence in Italy, the least represented nation in Tier 2. Given the rough data, this is at least consistent with motivational expectations from above.

Implications for youth, and Children’s Strike conformance to expectation
The top-ten ranking of Children’s Strike Weekly (CSW) events (as a ratio of national population) per nation, is mapped onto Chart 4. See the numbers trailing the nation name-labels (1=highest). Once again, this ranking picks out the leftmost nations, matching the section 4 expectation, albeit nations are ordered differently within the top-ten. The data is likely too rough to expect exact correspondence (of CSW to XR rank per nation, or of either to the exact trend prediction). However despite this, it’s noticeable that Spain and Italy seem rather far rightwards / religious to achieve CSW scores of 4 and 5 respectively, which brings us to an issue specific to youth.
In Western nations where religion is receding (occurs in all the top-ten CSW rankers), young adults are considerably less religious than older adults. While there are very few surveys involving children, this rule presumably extends downwards in age, given this is where young adults recently came from. So at the national level, children will behave as though they come from a nation rather to the left on Chart 4 of their actual home nation. Which is to say, as a group having more CBel and more climate activism, yet simultaneously less ABel so more skepticism. However, an issue with the ABel side of this is, as noted within this previous post, children are primed to pick up cultural templates (as provided by CCCC), but may not have developed a balancing ISk (yet, or ever). So, children’s CBel may be even more amplified.
The religiosity gap separating children and adults can also be different per nation, which will explain at least some CSW ranking changes relative to XR, also to any data reflecting mainly adult attitudes. Based upon projection from young / older adult data, Spain does indeed have an unusually big gap. This would explain Spain’s high CSW ranking. However, the same doesn’t hold for Italy, unless a similar strength effect for children hasn’t yet surfaced as they mature to adults. [See SI Footnote 7 and datafile for CSW details / data / source, plus Footnote 8 for religiosity gap].
The variability within ConBel / estimated CBel: GDP-per-Capita
As noted in Section 2, variability about the UN poll ConBel / CBel trend (all orange series in Chart 2/3), is significantly larger than for the (opposite direction) ABel trend (blue). To investigate this further (is it noise? something systemic? something to do with individual faiths?), I created Chart 5 below. This adds many more nations from the UN poll (but not covered by the main Climate Survey). The Y scale happens to match estimated CBel.
The chart is split into 4 main religio-regional blocks, a) to d), within which further subdivisions (religio-regional groups) are color-coded. Several of the latter overlap inside c), so I’ve assisted the eye with line connections for a couple of groups. Note: greyed-out nations are too unique or too far from any others to associate in a religio-regional group. [See Chart 5yx in SI datafile for full data].

This representation helps show the regional rather than Faith-related nature of our evolution away from religion, albeit some regions / Faiths essentially correspond. Hence, we will see regionality in attitudes to climate-change that result from the interaction of religion and CCCC. The variability about the main trend is so large it can’t be contained, so to speak, by some of the less sizeable Faiths or regions. Meaning that looking exclusively inside either, the main trend may not just appear weak, but non-existent or reversed. However, it’s clear from this depiction [and a comparative Faiths only color-coding, see SI datafile Chart 4yx] that the variability isn’t caused by Faiths or regionality either. So, where does it from?
It turns out that a lot of the variability is coming from GDP-per-Capita ranking (GDPpCR). 9 of 13 (not greyed out) nations forming the bottom-most band of the trend are below low (high number) GDPpCR thresholds per group [and for a) and b), per block too]. There’s also some highest (low number) GDPpCR nations per group on the uppermost edge, plus an upper threshold in block a). [SI Footnote 10 has detail on the GDPpC aspect]. Likely, the remaining variability is noise.
So, for a given religiosity, the publics of less-wealthy nations (lower GDPpCR), are even less disposed to transfer any serious cultural allegiance from their religious faith to CCCC. This is opposite to what one would expect if these publics were clamoring for more climate-change $ from richer nations, albeit some governments may be. The more pressured financial circumstances will sharpen reality-constraints still further, leading to still more ISk and less conversions into Core Belief. Such cultural mechanisms easily outbid a dream of filtered down $.
The number trailing the name-label of nations towards the top-left in Charts 4 & 5, is the national Electric Vehicle sales ranking. The next post covers cultural expectations for these figures.
Affirmative Public attitudes to Climate-Change are cultural not rational
The positions of nations on the various trendlines shown here represent the most affirmative attitudes to climate-change issues, and are all due to cultural not rational responses. Even the secondary GDPpCR angle that causes variation about the ConBel / CBel trend, is only the exacerbation of a cultural factor. These positions aren’t due to climate science or policies or the potential exposure of particular nations to any actual climate impacts. Knowing only national religiosity, allows a reasonable prediction of these CC affirmative attitudes, albeit for reality-constrained questions GDP-per-capita also sharpens the prediction. Prediction isn’t a goal in itself, but if verified and accurate, valuably confirms what’s actually happening.
For the religious (so mainly as revealed in religious nations), CCCC appears to be perceived as potentially competitive; their deep values aren’t shifting to it despite a cozier surface alliance clearly strong enough to disable their Innate Skepticism. Within irreligious nations, CCCC appears to be partially filling the recent cultural vacuum. All this leads to apparent paradoxes. In highly religious nations, the most climate concern lives simultaneously with the least priority, each dependent only upon the survey question types; maximum activism occurs within those nations having the most skepticism and so the least concern about climate-change in unconstrained questions. Yet as explained above, these paradoxical attitudes do follow the logic of cultural mechanisms.
Table 1 below summarizes the overall pattern of responses to ‘Strongly-Framed’ questions, i.e. reality-constrained questions where the constraint is better than ‘very weak’, or unconstrained questions where the emotive / existential / personal alignment to CCCC is better than ‘very weak’.
The final post shows that even affirmatives to Weakly-Framed climate survey questions, such as those encountered in the first post of this series, produce cultural not rational responses, albeit non-linear wrt religiosity. It also looks at elite attitudes and consequent policy penetration, plus further at the influence of youth, before summarizing the provisional findings across the whole series.

Admin notes
There are 3 posts in this series, all of which have the same style of Supplementary Information, which consist: 1) an expanded post, 2) a footnotes file, and 3) an Excel datafile. The text below is a streamlined post version, geared to get the concepts across more readily and uncluttered regarding side-issues, detail on methodology, intricate depth, path my exploration took etc. For folks who want more, the expanded post is ~4700 words. Be aware that the footnotes file, also having various external references, relates to the expanded post (though a couple are pointed at below). Likewise, all the chart IDs within the Excel datafile are numbered for the expanded post. However, all sources / data for the charts below can easily be found (I provided SI IDs in the text). The datafile includes various extra charts too.
Footnotes [Footnotes ]
Data File [Datafile ]
Extended post [ Extended Post]
via Climate Etc.
April 27, 2020 at 09:46PM
