Month: July 2020

Carbon dioxide level unprecedented in 15 MY… More evidence it’s not the climate control knob!

Guest “implied face palm” by David Middleton

From The Grauniad (where else?)

Figure 1. Lions and Tigers and Beras! The Grauniad

“Beras” is not a typo… I’m a big fan of the late Yogi Bera, and I will try to fit a Yogi’ism in here somewhere.

Standard Graunad tripe (or is it trope?)…

The amount of carbon dioxide in the Earth’s atmosphere is approaching a level not seen in 15m years and perhaps never previously experienced by a hominoid, according to the authors of a study.

At pre-lockdown rates of increase, within five years atmospheric CO2 will pass 427 parts per million, which was the probable peak of the mid-Pliocene warming period 3.3m years ago, when temperatures were 3C to 4C hotter and sea levels were 20 metres higher than today.

The Grauniad

Figure 2. Implied face palm.

The Grauniad article links to a very good paper (de la Vega et al., 2020). They compiled a high resolution reconstruction of Mid-Pliocene Piacenzian stage CO2 concentrations.

Figure 3. 300-450 ppm CO2 – Run away! (de la Vega et al., 2020)

If the Earth was 3-4 °C warmer with a much higher sea level 3.3 million years ago, with about the same CO2 concentration, what does this say about the potency of it as a climate control knob?

The last time CO2 levels were this low, Earth was in the deepest ice age of the Phanerozoic Eon, the Pennsylvanian (Late Carboniferous)-Early Permian.

Figure 4. “Anthropocene” CO2 levels are a lot closer to the C3 plant starvation (Ward et al., 2005) range than they are to most of the prior 540 million years. Data from this WUWT post by Bill Illis.

You can see that the atmospheric CO2 levels of the Pennsylvanian Period were comparable to the “Anthropocene” (yes, a fake word – but I use it for sarcastic effect). We can also see that Earth was perhaps even a bit colder then than it is today.

Figure 5. Phanerozoic temperatures (pH-corrected) and carbon dioxide. The Miocene is the first epoch of the Neogene Period (Berner et al, 2001 and Royer et al., 2004) (older is toward the left).

While estimates of Pennsylvanian-Permian CO2 concentrations vary widely, the average level was likely in the 400-450 ppm range. So Earth was at least somewhat colder the a similar CO2 concentration in the Late Paleozoic.

Thanks to Bill Illis, I have this great set of paleoclimate spreadsheets.  One of the paleo temperature data sets was the pH-corrected version of Veizer’s Phanerozoic reconstruction from Royer et al., 2004.  The Royer temperature series was smoothed (spline fit?) to a 10 million year sample interval matching Berner’s GeoCarb III,  thus facilitating cross-plotting.

A cross-plot the pH-corrected Phanerozoic temperatures with CO2 yields a climate sensitivity of 1.28 °C per doubling, very much in line with recent observation-based low sensitivities. More of a treble adjustment, rather than a control knob.

Figure 6. Phanerozoic CO2 vs temperature. Unlabeled x-axis is in millions of years before present.

Royer’s pH corrections were derived from CO2, so it shouldn’t be too much of a surprise that the correlation was so good (R² = 0.6701)… But the low climate sensitivity is truly “mind blowing”… /Sarc.

The notion of Phanerozoic Eon climate change being driven by atmospheric carbon dioxide levels was generally scoffed at as recently as the 1970’s.

Suggestion that changing carbon dioxide content of the atmosphere could be a major factor in climate change dates from 1861, when it was proposed by British physicist John Tyndall.

[…]

Unfortunately we cannot estimate accurately changes of past CO2 content of either atmosphere or oceans, nor is there any firm quantitative basis forestimating the the magnitude of drop in carbon dioxide content necessary to trigger glaciation.  Moreover the entire concept of an atmospheric greenhouse effect is controversial, for the rate of ocean-atmosphere equalization is uncertain.

Dott & Batten, 1976

What about 15 million years ago?

There is a school of thought that the warmth of 15 million years ago, the Mid-Miocene Climatic Optimum (MMCO) was driven by CO2 released from the flood basalt eruptions of the Columbia River Basalt Group (CRBG).

Figure 7. I feel as if I’ve written this before… Yogi’ism #1. Midwest Capital Advisers

According to Kashbohm & Schoene (2018)…

Flood basalts, the largest volcanic events in Earth history, are thought to drive global environmental change because they can emit large volumes of CO2 and SO2 over short geologic time scales. Eruption of the Columbia River Basalt Group (CRBG) has been linked to elevated atmospheric CO2 and global warming during the mid-Miocene climate optimum (MMCO) ~16 million years (Ma) ago. However, a causative relationship between volcanism and warming remains speculative, as the timing and tempo of CRBG eruptions is not well known. We use U-Pb geochronology on zircon-bearing volcanic ash beds intercalated within the basalt stratigraphy to build a high-resolution CRBG eruption record. Our data set shows that more than 95% of the CRBG erupted between 16.7 and 15.9 Ma, twice as fast as previous estimates. By suggesting a recalibration of the geomagnetic polarity time scale, these data indicate that the onset of flood volcanism is nearly contemporaneous with that of the MMCO.

Kashbohm & Schoene (2018)

It does appear that the timing of the vast majority CRBG eruptions can be fairly well tied down to a 700,000 to 900,000 year period coincident with the Mid-Miocene Climatic Optimum. However, even with the prodigious volume of CO2 associated with flood basalt eruptions, it’s not enough to significantly move the “climate needle”:

A statistic: It is estimated that an erupting basalt lava flow with a volume of 2000 km3 would release approximately 7 billion tonnes of carbon (or 26 billion tonnes of CO2).

This is about the same as the amount currently released by burning of fossil fuels – each year.

Saunders & Reichow

Armstrong McKay et al., 2014 estimated that the main phase of the CRBG eruptions, along with “cryptic degassing” of country rock, etc., emitted 4,090 to 5,670 billion tons of carbon over a 900,000 period. This only works out to 5-6 million tonnes of carbon per year… That’s an order of magnitude less than a rounding error. Our current 10 billion tonnes per year is only equivalent to 3% of the total annual sources in the Earth’s carbon budget. Self et al., 2005 found that CO2 emissions from flood basalt eruptions were insignificant relative to the mass of CO2 in the atmosphere and unlikely to have played a signifcant role in past episodes of “global warming.” Although they did note that the sulfur gas emissions may truly have been unprecedented.

While the impact of volcanic S gas release may be profound, the mass of CO2 directly released by individual flood lava eruptive events is tiny in comparison to the normal mass in the troposphere and stratosphere. The predicted increases in atmospheric concentration are a fraction of the current anthropogenic CO2 released from hydrocarbon burning (~25 Gt per year). Moreover, while the amount of CO2 in the atmosphere is currently ~3000 Gt, it was perhaps double this value during the late Cretaceous (i.e. ~6000 Gt). It is therefore unlikely that volcanic CO2 had a direct effect on mechanisms of global warming, supporting earlier findings by Caldeira and Rampino (1990). In addition, there would have been more than sufficient time for the extra mass of CO2 added to equilibrate, given that the lava-forming eruptive events must have been spaced at least hundreds, and probably thousands, of years apart. By contrast, SO2 emissions and the atmospheric burden of sulfate aerosols generated during flood basalt events appear to be unprecedented at any other time in Earth history. Acid rain may also have been widespread. What is less certain is whether affected biota would have had time to recover from the deleterious effects of sulfate aerosol clouds and acid rain, although quiescent intervals lasting millennia appear to offer ample time for the recovery of local biological and environmental systems (Jolley 1997).

Self et al., 2005

This ultimately takes us full-circle back to my Historical Geology textbook…

Unfortunately we cannot estimate accurately changes of past CO2 content of either atmosphere or oceans, nor is there any firm quantitative basis for estimating the the magnitude of drop in carbon dioxide content necessary to trigger glaciation.  Moreover the entire concept of an atmospheric greenhouse effect is controversial, for the rate of ocean-atmosphere equalization is uncertain.

Dott & Batten, 1976

We can’t even be certain that the atmospheric concentration of CO2 during the Mid-Miocene Climatic Optimum was significantly elevated relative to the extremely low values of the Quaternary Period.

Figure 8. Neogene-Quaternary temperature and carbon dioxide (older is toward the left).

We can see that the range of estimates for MMCO range from 250 to 500 ppm, rendering any efforts to draw conclusions about the CRBG, CO2, MMCO totally pointless. According to Pagani et al, 1999:

There is no evidence for either high pCO2 during the late early Miocene climatic optimum or a sharp pCO2 decreases associated with EAIS growth.

Pagani et al., 1999

Pagani et al., suggest that changes in oceanic circulation driven by plate tectonics (opening of the Drake Passage) and the presence (or lack thereof) of a large polar ice sheet were the primary drivers of Miocene climate change. And this takes us to another of my 1970’s Earth Science textbooks:

FORECASTING THE FUTURE. We can now try to decide if we are now in an interglacial stage, with other glacials to follow, or if the world has finally emerged from the Cenozoic Ice Age. According to the Milankovitch theory, fluctuations of radiation of the type shown in Fig. 16-18 must continue and therefore future glacial stages will continue. According to the theory just described, as long as the North and South Poles retain their present thermally isolated locations, the polar latitudes will be frigid; and as the Arctic Ocean keeps oscillating between ice-free and ice-covered states, glacial-interglacial climates will continue.

Finally, regardless of which theory one subscribes to, as long as we see no fundamental change in the late Cenozoic climate trend, and the presence of ice on Greenland and Antarctica indicates that no change has occurred, we can expect that the fluctuations of the past million years will continue.

Donn, William L. Meteorology. 4th Edition. McGraw-Hill 1975. pp 463-464

Despite having less than 12 years to solve the “climate crisis,” we are still living in an Ice Age, and will be so long as Antarctica remains isolated over the southern polar region, Greenland retains its ice sheet and the northern polar region retains at least seasonal ice cover.

Figure 9. From Zachios et al., 2001 (older is toward the bottom).

The roughly 1.0 °C of warming since the coldest climatic period of the Holocene, the Little Ice Age, hasn’t budged us out of the Quaternary Period temperature “noise level.”

Figure 10. High Latitude SST (°C) From Benthic Foram δ18O (Zachos, et al., 2001) and HadSST3 ( Hadley Centre / UEA CRU via http://www.woodfortrees.org) plotted at same scale, tied at 1950 AD (older is toward the left).

Another 0.5 to 1.0 ºC between now and the end of the century doesn’t even put us into Eemian climate territory, much less the Miocene or even the Pliocene. We will still be in the Quaternary Period noise level. Bear in mind that the instrumental temperature data are of much higher resolution than the δ18O derived temperatures. As such, the δ18O data reflect the bare minimum of dynamic amplitude range. Actual paleo temperatures would have reflected a far greater range of variability (higher highs and lower lows).

When you come to a fork in the road…

Figure 11. Yogi’ism #2 AZ Quotes

When you come to a fork in the road, take it… unless that fork follows an utterly failed paradigm. While there is ample evidence that atmospheric CO2 levels have some effect on the bulk temperature of the troposphere, the notion that it was a primary driver of climate change was scoffed at as recently as the 1970’s.

This sort of nonsense is… nonsense:

At pre-lockdown rates of increase, within five years atmospheric CO2 will pass 427 parts per million, which was the probable peak of the mid-Pliocene warming period 3.3m years ago, when temperatures were 3C to 4C hotter and sea levels were 20 metres higher than today.

So what? We can take a long walk through deep time and find lots of periods when temperatures and sea levels were much higher with CO2 levels ranging from 250 to 2,500 or more ppm. We don’t find many periods when it was colder than today, with lower sea levels.

Figure 12.  L-R: Relative sea level (Miller et al., 2005), atmospheric CO(Berner & Kothavala, 2001) and temperature anomalies (Royer et al., 2004) since Late Jurassic Period (170 MYA).

If you just go with the observations, you won’t take the wrong fork.

Figure 13. Yogi’ism #3. (Goalcast)

When did CO2 become the control knob?

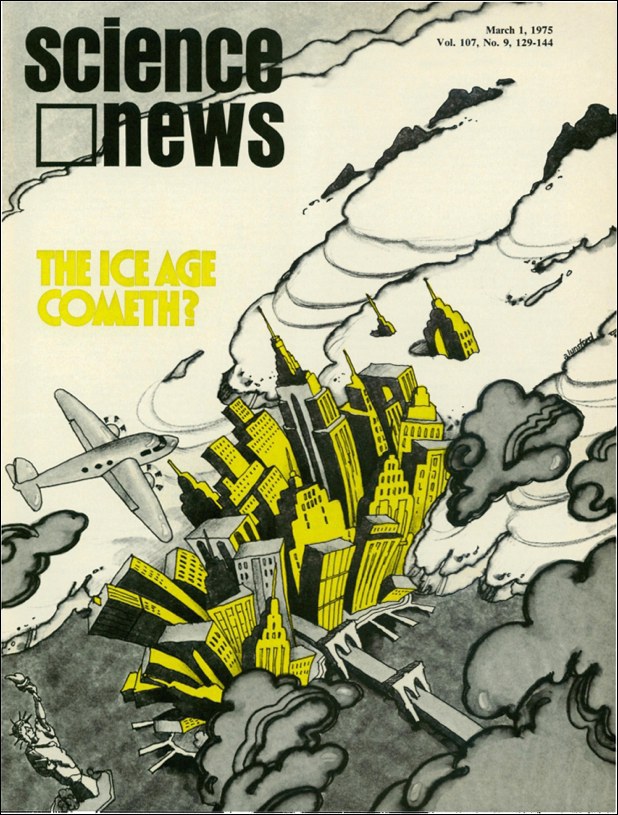
We can see from my college text books and the geological record that CO2 wasn’t the control knob as recently as 1976. For than matter, the March 1, 1975 cover of Science News magazine was 180 degrees out of phase with today’s narrative.

Figure 14. Science News March 1, 1975

The much-vaunted IPCC tells us that all of the warming since The Ice Age Cometh is due to human activities, primarily COemissions.

Figure 15. Figure TS.23 from IPCC AR4. The lower panel (b) has two curves. The black curve depicts IPCC’s version of observed temperature changes since 1900. The blue curve is what IPCC says how temperatures would have evolved “if humans had not contributed to greenhouses gases in any way at all”, or at least not very much.

As can be seen in TS.23 (b), according to the IPCC, the human contribution to global temperatures was insignificant before The Ice Age Cometh in 1975.

Figure 16. How the Current Fake Climate Crisis Saved Us From… That 70’s Climate Crisis Show

Back to The Grauniad

I was so busy with the geology stuff that I forgot to quote the funniest bit of The Grauniad article…

“A striking result we’ve found is that the warmest part of the Pliocene had between 380 and 420 parts per million CO2 in the atmosphere,” one of the co-authors Thomas Chalk, said. “This is similar to today’s value of around 415 parts per million, showing that we are already at levels that in the past were associated with temperature and sea-level significantly higher than today.”

“Currently, our CO2 levels are rising at about 2.5 ppm per year, meaning that by 2025 we will have exceeded anything seen in the last 3.3 million years.”

The authors said the study of the past provided a guide to what is likely to happen in the future as the Earth responds to the buildup of greenhouse gas from the past two centuries of industrial emissions.

“Ice sheets today haven’t had a chance to catch up with CO2 forcing. We are burning through the Pliocene and heading towards a Miocene-like future,” said another of the authors, Gavin Foster, a professor of isotope geochemistry at the University of Southampton. “We now have to go further back in time to find situations that are relevant.”

The Grauniad

Figure 17. Yogi might have said this… But it’s credited to Larry the Cable Guy.

The authors said the study of the past provided a guide to what is likely to happen in the future as the Earth responds to the buildup of greenhouse gas from the past two centuries of industrial emissions.

The problem with today’s academic geology is that, all too often, they get the principle of uniformitarianism bass-ackwards.

The past history of our globe must be explained by what can be seen to be happening now. No powers are to be employed that are not natural to the globe, no action to be admitted except those of which we know the principle.

James Hutton, 1785

“The past history of our globe must be explained by what can be seen to be happening now,” not by model-derived assumptions about what’s happening now. The assumption that CO2 is the primary driver of modern climate change now has polluted interpretations of the past, leading to wildly exaggerated estimates of climate sensitivity and models which have consistently overestimated the predicted warming. I think Yogi had one for this too.

Figure 18. Yogi’ism #4 (First Coast Advisers

But, of course…

Figure 19. Yogi’ism #5 (AZ Quotes)

Five Yogi’ism’s in one post! Unprecedented?

References

Armstrong McKay, David, Toby Tyrrell, Paul A. Wilson, & Gavin Foster. (2014). “Estimating the impact of the cryptic degassing of Large Igneous Provinces: A mid-Miocene case-study”. Earth and Planetary Science Letters. 403. 254–262. 10.1016/j.epsl.2014.06.040. Special thanks to David Armstrong McKay for kindly sending me a copy of his paper.

Berner, R.A. and Z. Kothavala, 2001. GEOCARB III: A Revised Model of Atmospheric CO2 over Phanerozoic Time, American Journal of Science, v.301, pp.182-204, February 2001.

de la Vega, E., Chalk, T.B., Wilson, P.A. et al. Atmospheric CO2 during the Mid-Piacenzian Warm Period and the M2 glaciation. Sci Rep 10, 11002 (2020). https://ift.tt/2W7ngzT

Donn, William L. Meteorology. 4th Edition. McGraw-Hill 1975. pp 463-464

Dott, Robert H. & Roger L. Batten.  Evolution of the Earth.  McGraw-Hill, Inc.  Second Edition 1976.  p. 441.

Illis, B. 2009. Searching the PaleoClimate Record for Estimated Correlations: Temperature, CO2 and Sea Level. Watts Up With That?

Kasbohm, Jennifer, and Blair Schoene. “Rapid Eruption of the Columbia River Flood Basalt and Correlation with the Mid-Miocene Climate Optimum.” Science Advances, American Association for the Advancement of Science, 1 Sept. 2018, advances.sciencemag.org/content/4/9/eaat8223.

Miller, Kenneth & Kominz, Michelle & V Browning, James & Wright, James & Mountain, Gregory & E Katz, Miriam & J Sugarman, Peter & Cramer, Benjamin & Christie-Blick, Nicholas & Pekar, S. (2005). “The Phanerozoic Record of Global Sea-Level Change”. Science (New York, N.Y.). 310. 1293-8. 10.1126/science.1116412.

Pagani, Mark, Michael Arthur & Katherine Freeman. (1999). “Miocene evolution of atmospheric carbon dioxide”. Paleoceanography. 14. 273-292. 10.1029/1999PA900006.

Royer, D. L., R. A. Berner, I. P. Montanez, N. J. Tabor and D. J. Beerling. CO2 as a primary driver of Phanerozoic climate.  GSA Today, Vol. 14, No. 3. (2004), pp. 4-10

Self, Stephen & Thordarson, Thorvaldur & Widdowson, Mike. (2005). “Gas Fluxes from Flood Basalt Eruptions”. Elements. 1. 10.2113/gselements.1.5.283.

Tripati, A.K., C.D. Roberts, and R.A. Eagle. 2009.  “Coupling of CO2 and Ice Sheet Stability Over Major Climate Transitions of the Last 20 Million Years”.  Science, Vol. 326, pp. 1394 1397, 4 December 2009.  DOI: 10.1126/science.1178296

Zachos, J. C., Pagani, M., Sloan, L. C., Thomas, E. & Billups, K. “Trends, rhythms, and aberrations in global climate 65 Ma to present”. Science 292, 686–-693 (2001).

Like this:

Like Loading…

Related

via Watts Up With That?

https://ift.tt/3iNGvIC

July 10, 2020 at 08:37PM

” Kill Climate Deniers” meets “44 Sex Acts”

The 2018 winner was Nakkiah Lui. Ms Lui was on the ABC (of course)  in the March 27 episode last year of Get Crackin. Ms Lui shouts (from 27.00 minutes),

 OKAY! Fuck GUBBAS! FUCK WHITEY! Shit on your colonisation [she lowers her knickers to her ankles and mimes defecating]… Fuck it, fuck it. BURN THIS PLACE TO THE GROUND!”

I have mentioned this to reference the hypocritical promotion of leftist low culture and abuse by the arts world and ABC. The left pretends horror about, say, an Alan Jones semantic gaffe (“put a sock down her throat”) while fawning over Kill Climate Deniers. Who can forget that 2011-12 era of local climate scientists clutching their pearls over “death threats”? They ranged from catastrophist Will Steffen beclowning himself regarding overheard remarks about the culling of the ACT’s kangaroos, to Anna Maria-Arabia, later to become CEO of the Academy of Sciencereporting a death threat to herself in June 2012.[4]  That was nothing more than a serial pest in Seattle spraying templated abuse worldwide. I anatomised the Academy’s hysteria over “death threats” here, concluding, “These brave climate warriors dissolve into puddles of jelly if a rude email hits their inbox.”

Finnigan himself is so far on the left that he ranks Malcolm Turnbull as a climate-denying shill, in thrall to the resources industries.Finnigan says, “These deniers may understand the science, they may be aware that they’re completely in the wrong, but they’ll willingly lie through their teeth in order to maintain the status quo. Their (sic) main tactic of this group is distraction — talk about anything but the science. ‘Baseload’, ‘energy security’, ‘struggling farmers’ — anything except the elephant in the room. Example: Malcolm Turnbull.”

Reluctantly I must now enlighten you on the 44 Sex Acts script, which Finnigan describes as “dope as hell”, “weirdly straight, as in heteronormative af [as f-k]” and the straightest (and best) play he’s ever written, with the collaboration of some beautiful humans .

Most Quadrant fans are no longer in need of Parental Guidance. All the same, some might find the following material distressing.

Precis: A romantic comedy about lifestyle blogger Celina Valderrama, giving the unenviable task of reviewing a new coffee table book entitled THE 44 SEX ACTS YOU MUST TRY BEFORE YOU DIE.

Celina has until Friday to try out all 44 acts – but the only partner available is her arch-nemesis, animal activist Alab Delusa. Now, it’s a race against time as Celina and Alab run the gamut of the human sexual experience. From vanilla to kinky, dress-ups to BDSM, pegging to orgies, the reluctant partners must pull off an Olympian feat of endurance stunt fucking.

In my innocence I looked up “pegging” in Urban Dictionary and now wish I hadn’t.

Over the course of one epic week, lines will be crossed, boundaries broken and raw edges exposed. Will the friction between these two sworn enemies turn into something more?

SCENE: Celina’s house. There are costume items and sex toys laid out all over the bed and furniture. Celina is dressing in stockings and heels / some other kind of sexy dress-up outfit.

Celina:  Okay so this is my plan. I think if we’re smart, we can string them together, 1-2-3-4 and so on, for maximum speed and efficiency. We move from vulva licks to 69s to blindfolds to hair pulling to using the vibrator on my neck, bang bang bang bang. How much do you come?

Alab:  What? Like how many spasms?

Celina: There’s like four that vary on where you’re supposed to ejaculate, and I think we can do them all together…. Start by you coming on my stomach, then on my ass, then on your ass, then in your hair…

(Online editor’s note: That’s quite enough of this excerpt, Tony. Readers curious to know more of the couple’s to-do list can visit Pornhub, where such activities are staged and viewed without benefit of taxpayer assistance.)

The same lack of subtlety, shall we say, infuses Kill Climate Deniers. Female characters shoot each other in the face, stomach or repeatedly in the chest to a background soundtrack of the author’s favourite rock music.

Finnigan offered this in Kill Deniers script:

Catch (terrorist leader) to Beverly Ile (TV journalist): Take this [gun] and shoot someone in the audience now, or I’ll shoot you in the neck …

[Catch shoots Ile in the stomach. Ile drops to the ground screaming]…

[Catch shoots Remely Clark in the face.]

Catch: Oh my god, brains everywhere.

Remely Clark is CEO of a fictional mining company Goonyarra Station. In one apparent slip Finnigan refers to it as “Adani Goonyarra Station”.

Lest you think that Kill Climate Deniers was just a bubble in the woke brook, it did 45 performances at the 105-seat Griffin Theatre in 2018. “It’s Kill Bill meets Tim Flannery, and it’s all true. The science is real,” blurbed Griffin. It was scheduled for runs this year at Sydney University Dramatic Society (SUDS), Melbourne, Launceston, Prague and London. Mercy-killed by the COVID virus, it got up only for several SUDS performances, to critics’ hosannas.[5]

Finnigan makes no secret of his own philosophy, saying “deniers” are “completely right” in warning of climate conspiracies for “massive social change” beyond what most people have comprehended, writing:

They see it as a confected excuse for a massive program of state regulation … In some ways, they grasp what’s at stake in this debate more clearly than the rest of us.

Like kids at a pyjama party scaring each other with ghost stories, the arts/theatre crowd revels in apocalyptic nonsense. Finnigan says,

The 2020s are going to be a wild fucking ride. The anger of the climate movement is going to grow. Now there may be a point where the disasters become so frequent and extreme enough that we can no longer have a global conversation anymore – basically everyone just too desperate trying to survive in their own patch, with tens or hundreds of millions of people fleeing north and south from the equatorial regions.

On the other hand, a significant mass of people are growing increasingly angry about how our futures are being burned up to feed the profits of a few rich fuckwits. Extinction Rebellion and the Schools Strikes are an escalation from previous climate activist movements, but they are a precursor to the next phase. There are going to be some big clashes in this decade…

Between now and 2024, every country – particularly Australia – is going to suffer some major disasters, driven and exacerbated by climate change. People will die.

These deaths can be attributed to human action. If my parents die in a heatwave that could have been prevented, you can fucking bet I’m coming after the weak and corrupt politicians that facilitated that disaster.

_________________________

Fact checks

# The IPCC 2018 special report once again found that there is little basis for claiming that drought, floods, hurricanes, tornadoes have increased, much less increased due to greenhouse gases.

# After 40 years of relatively strong global warming, world cereal grain is forecast by the UN’s FAO to hit record production for the second year in a row in 2020. That’s a crisis?

_________________________

Finnigan has his non-solution to a non-problem: unselfish struggle against CO2 emissions. “By 2024, we’ll be fighting the real fight that will define the rest of our lives: mutualism or selfishness.” Still, there’s a problem. Finnigan is a consummate flyer, darkening the skies with his contrails. In 2017 for example he began with Perth, Canberra, Melbourne and Sydney, then in March to Shanghai, followed by London, Sweden, London, and Manila.

He brushes this aside as a way for his detractors “to displace their own guilt about the fact that they’re doing nothing to address the crisis.” He continues, “It’s boring and inane. If that’s you, stop it. We could turn this around right now if it weren’t for the actions of a few thousand wealthy men who are happy to sacrifice our collective future for their personal profit … No matter what happens in our lifetime, our obligations are the same: to fight rich fuckwits, to bear witness to what’s happening without hiding from it, and to be kind to each other.”

And the author of Kill Climate Deniers has also said, “So, to the deniers, good luck. I hoped that you’d die. Not because I hate you, but just so the rest of us can get on with the work you’re delaying.” Predictably, in further proof that the frothing Left would have to invent Rupert Murdoch to round out its demonology of arch villains, Finnigan also wants to “Destroy News Corp.”

His own explicit contribution to global cooling is somewhat lacklustre: he tries to write a climate letter to politicians or CEOs fortnightly. He wants everyone to “swamp politicians’ mailboxes and they would have no choice but to take it seriously.” Meanwhile, it’s ‘Here’s your boarding pass Mr Finnigan’.

He’s now working on what he calls an “epic” eight-hour show about climate change to be performed in 2024 – “a huge spectacle, a wild experience: a novel, a journey, a battle, a prayer, a party.” Move over, Wagner, and take your trivial Ring Cycle with you.

See also: How to Make it in Luvvie Grantland

Finnigan operates in a pre-capitalist sort of way, seeking patronage from the contemporary equivalent of aristocrats, much as Mozart traipsed from court to court, flattering counts and princelings and reaping their largesse as a result. The modern-day aristocrats are those dispensing taxpayers’ or foundations’ money (invariably other people’s money) as grants, prizes, gigs and residential sojourns. The Australia Council and Melbourne’s Wheeler Centre are local examples. As Finnigan describes London (my emphasis)

There are many, many arts and cultural institutions here that create a full-blown arts ecology, crowded and dense, with many many places where a person can carve out a niche.

And, bluntly, there’s money.

It’s expensive to live here, but there’s money moving through this system, and people willing to try new things and ready to experiment.

Hence it’s easy for Finnigan and his fellow-supplicants to advocate capitalism’s destruction and replacement by their green taxpayer-funded nirvana. By the way, can anyone imagine for one second a Greens/Labor government funding its ideological opponents? Compare normal Left ruthlessness with Prime Minister Morrison’s special handout to the arts of $250m last month, and Boris Johnson’s £1.5b handout this week.

Rounding off, I was puzzled at Finnigan’s statement that he works with Climate and Earth System scientists from the Australian Academy of Science and other august bodies.

I emailed him (partly pranking),

Hi David, love your work! 

I note you have referenced some collaboration with the Australian Academy of Science. What was that all about? Thanks, Anthony Thomas.

Finnigan wasn’t born yesterday, and replied “LOL” (laugh out loud), to which I replied with his own preferred salutation, “Peace!”

I then sent this to the Academy of Science: “What has been the role of David Finnigan with the AAS? Were those roles involving payment from AAS or voluntary?”

The Academy, after a long search, came back with this:

David Finnigan attended a workshop at the Shine Dome [AAS headquarters] on a voluntary basis in 2013.

Mmm. Impressive!

Tony Thomas’s new book, Come to think of it – essays to tickle the brain, is available as book ($34.95) or e-book ($14.95) here.


[1] Griffin Theatre collected $1.85m from the Australia Council this year as a four year grant.

[2] The Copyright Agency’s CEO trousered $490,000 back in 2013. That’s the last public disclosure.

[3] 2012: A Churchill Fellowship worth well over $25,000 in today’s money.

2012-14: $36,700 for Boho, the arts think-tank he founded in 2006

2014: a $19,000 grant from the ACT government to write Kill Climate Deniers

2014: a $60,000 two-year grant from the Australia Council for a Creative Australia Fellowship

2015: AsiaLink (Melbourne University) Fellow for a Philippines residency (value unspecified).

2017: $10,000 Griffin Theatre Award for Kill Climate Deniers


[4] Steffen was convinced his ANU troupe was under threat from “a sniper”.

[5] Said Honi Soit’s critic Prudence Wilkins-Wheat: “Partial to the title and plot, I had a suspicion that I was going to like this play.” She loved an older gentleman in the front row being labelled a “possible right-wing stooge”, and the play’s

“hilarious satire of mining company propaganda” and take-down of “evil climate deniers”. In my days at uni, students took pride in being rebels rather than conformists like Ms Wilkins-Wheat.

via Climate Scepticism

https://ift.tt/2ZhNuBR

July 10, 2020 at 07:48PM

Facebook: Act Thoughtfully to Maintain Freedom of Speech and the Integrity of Scientific Inquiry

July 10, 2020

To: Helle Thorning-Schmidt, Facebook Oversight Board
Cc: Mark Zuckerberg, Afia Asantewaa Asare-Kyei, Evelyn Aswad, Endy Bayuni, Catalina Botero-Marino, Katherine Chen, Nighat Dad, Jamal Greene, Pamela Karlan, Tawakkol … Continue reading

via Friends of Science Calgary

https://ift.tt/2AO016L

July 10, 2020 at 05:18PM

Hottest Day Ever in Australia Confirmed: Bourke 51.7°C, 3rd January 1909

Reposted from Jennifer Marohasy’s Blog

July 10, 2020 By jennifer

The Australian Bureau of Meteorology deleted what was long regarded as the hottest day ever recorded in Australia – Bourke’s 125°F (51.7°C) on the 3rd January 1909. This record* was deleted, falsely claiming that this was likely some sort of ‘observational error’, as no other official weather stations recorded high temperatures on that day.

However, Craig Kelly MP has visited the Australian National Archive at Chester Hill in western Sydney to view very old meteorological observation books. It has taken Mr Kelly MP some months to track down this historical evidence. Through access to the archived book for the weather station at Brewarrina, which is the nearest official weather station to Bourke, it can now be confirmed that a temperature of 50.6°C (123°F) was recorded at Brewarrina for Sunday 3rd January 1909. This totally contradicts claims from the Australian Bureau of Meteorology that only Bourke recorded an extraordinarily hot temperature on that day.

Brewarrina Meteorological Observations Book, January 1909 — photographed by Craig Kelly MP. Note 123F recorded at 9am on 4th January 1909.

Just today, Friday 10th July 2020, Mr Kelly MP obtained access to this record for Brewarrina, the closest official weather station to the official weather station at Bourke.

He has photographed the relevant page from the observations book, and it shows 123°F was recorded at 9am on the morning of Monday 4th January 1909 – published here for the first time. This was the highest temperature in the previous 24 hours and corroborates what must now be recognised as the hottest day ever recorded in Australia of 51.7°C (125°F) degrees at Bourke on the afternoon of Sunday 3rd January 1909.

The Meteorological Observations Book for Bourke for January 1909 records 125°C for 3rd January. Photograph taken on 26th June in 2014 at the Chester Hill archive by Jennifer Marohasy.

That the Bureau of Meteorology denies these record hot days is a travesty. Is it because these records contradict their belief in catastrophic human-caused global warming?

The temperature of 50.6°C (123°F) recorded back in 1909 which is more than 100 years ago, photographed by Mr Kelly today at the National Archives in Chester Hill, is almost equivalent to the current official hottest day ever for Australia of 50.7 degrees Celsius at Oodnadatta on 2nd January 1960. These are in fact only the fourth and third hottest days recorded in Australia, respectively.

Not only has Mr Kelly MP tracked-down the meteorological observations book for Brewarrina, but over the last week he has also uncovered that 51.1°C (124°F) was recorded at White Cliffs for Wednesday 11th January 1939. This is the second hottest ever!

The evidence, a photograph from the relevant page of the White Cliff’s meteorological observations book, is published here for the first time.

This photograph from the White Cliffs Meteorological Observation Book shows the second hottest temperature ever recorded in Australia using standard equipment in a Stevenson screen.

Until the efforts of Mr Kelly MP, this second hottest-ever record was hidden in undigitised archives.

It is only through the persistence of Mr Kelly to know the temperatures at all the official weather stations in the vicinity of Bourke that this and other hot days have been discovered.

If we are to be honest to our history, then the record hot day at Bourke of 51.7°C (125°F) must be re-instated, and further the very hot 50.6°C (123°F) recorded for Brewarrina on the same day must be entered into the official databases.

Also, the temperature of 51.1°C (124°F) recorded at White Cliffs on 12th January 1939 must be recognised as the second hottest ever.

For these temperatures to be denied by the Bureau because they occurred in the past, before catastrophic human-caused global warming is thought to have come into effect, is absurd.

At a time in world history when Australians are raising concerns about the Chinese communist party removing books from Libraries in Hong Kong, we should be equally concerned with the Australian Bureau of Meteorology removing temperature records from our history.

If global warming is indeed the greatest moral issue of our time, then every Australian regardless of their politics and their opinion on greenhouse gases and renewable energies, must be honest to history and these truths.

____

* This temperature (125°F/51.7°C on the 3rd January 1909) was recorded at an official Bureau weather station and using a mercury thermometer in a Stevenson screen. Hotter temperatures were recorded in 1896 but the mercury thermometers were not in Stevenson screens, which is considered the standard for housing recording equipment.

The feature image shows Craig Kelly MP at The Australian National Archive, Chester Hill, just today examining the Brewarrina Meteorological Observations book.

I have previously blogged on the record hot day at Bourke being deleted by the Bureau here:
https://jennifermarohasy.com/2017/02/australias-hottest-day-record-ever-deleted/

Like this:

Like Loading…

Related

via Watts Up With That?

https://ift.tt/3gKdOuj

July 10, 2020 at 04:36PM