
California’s failure to manage its forests so as to limit wildfires offset much if not all of the state’s expensive efforts to reduce its greenhouse emissions. Three charts from the California government and some back-of-the-envelope calculations indicate this.

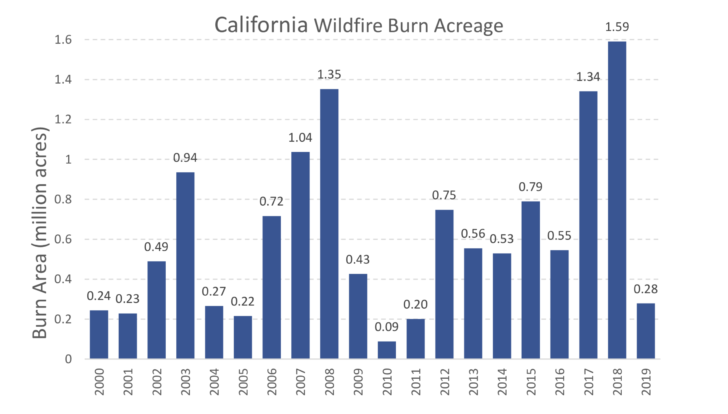
First, here is the burn acreage for 2000-2019. Note that in 2019, for example, wildfires consumed 280,000 acres of California’s forests.
Next, here are the CO2 emissions caused by those wildfires. Note that in 2019, for example, wildfires produced 6.5 million tons of CO2.
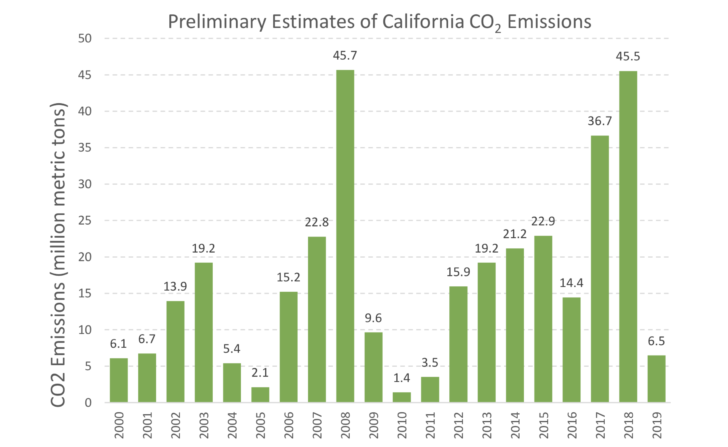
Now, so far in 2020, about 3.4 million acres of California forests have burned. If 280,000 acres of burned forests produced 6.5 million tons of CO2 in 2019, then using the same proportion, 3.4 million burned acres have produced about 79 million tons of CO2 in 2020 alone.
Now, here is the chart of California emission reductions between 2000-2017 (the latest available from the state). Note that California emissions as of 2017 were slightly below the state’s 2020 emissions goal of 430 million tons.
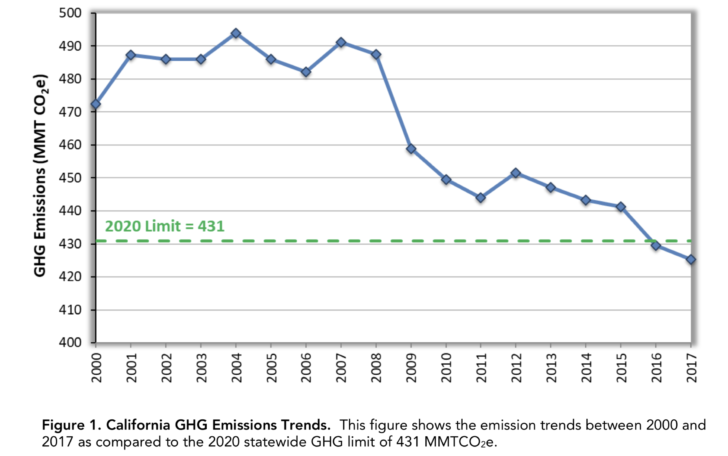
Let’s assume that the state is still around the same level of emissions as 2017. If you add back in the emissions from this years fires (79 million tons), California is not only about 79 million tons above its emissions goal, but California’s emissions are slightly higher than the state’s emissions peak of 493 million tons in 2004.
But there’s more.
California began it cap-and-trade system for emissions in 2012. The state has raised and spent about $5 billion from that program.
Assuming that emissions cuts for 2018 and 2019 amounted to a total of 10 million tons and the total emissions cuts under the cap trade program from 2012-2017 amount to about 25 tons, the 2020 forest fire emissions (79 million tons) more than double the emissions cut since cap-and-trade was implemented in 2012 (35 tons).
And we haven’t even added back in the emissions from other post-2012 wildfires (a total of about 182 million tons).
Here are some concluding points:
via JunkScience.com
September 17, 2020 at 08:56AM
