
via Real Climate Science
January 31, 2022 at 08:52PM
Roger Caiazza
It has been a month since I updated Watts Up With That readers on New York’s net-zero by 2050 plan the Climate Leadership and Community Protection Act (Climate Act). My last post explained that the Draft Scoping Plan that defines how to “achieve the State’s bold clean energy and climate agenda” had been released and is available for comment. This post notes that there is a new Draft Scoping Plan Overview available. I also want to address their claim that the “cost of inaction exceeds the cost of action by more than $90 billion.
Background
The Climate Act was passed in 2019 and became effective on 1/1/2020. The Climate Action Council has been working since then to develop plans to implement the Act. Starting in the fall of 2020 seven advisory panels developed recommended policies to meet the targets that were presented to the Climate Action Council in the spring of 2021. Over the summer of 2021 the New York State Energy Research & Development Authority (NYSERDA) and its consultant Energy + Environmental Economics (E3) prepared an Integration Analysis to “estimate the economy-wide benefits, costs, and GHG emissions reductions associated with pathways that achieve the Climate Act GHG emission limits and carbon neutrality goal”. Three Integration Analysis implementation strategies were incorporated into the Draft Scoping Plan when it was released at the end of 2021.
The Draft Scoping Plan document is huge. The document is 861 pages long and the body of the Scoping Plan report itself is 330 pages. There are eight appendices available individually:
The newly released Draft Scoping Plan Overview gives some more details on the implementation plan and is a pretty good introduction to New York’s green new deal law. Not only does the law mandate net-zero GHG emissions by 2050 but there are social justice components as well. I am only going to touch on one aspect of the overview because it epitomizes the charade of the Climate Act.
Cost of Inaction Exceeds the Cost of Action
Slide 9 Key Benefit-Cost Findings in the Overview summary claims that the “Cost of Inaction Exceeds the Cost of Action by more than $90 billion”. It goes on to explain: “There are significant required investments to achieve Climate Act GHG Emissions Limits, accompanied by even greater external benefits and the opportunity to create hundreds of thousands of jobs”.

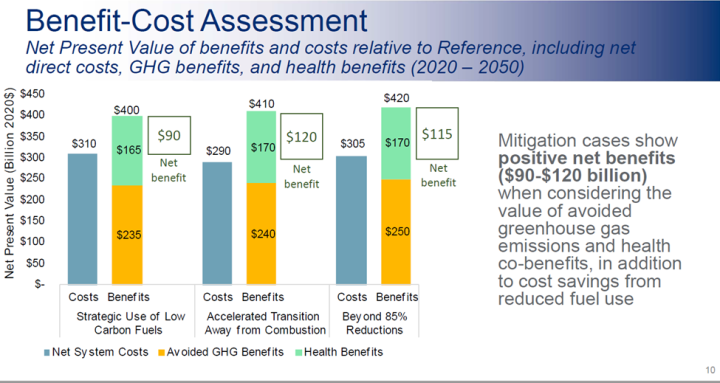
Slide 10, Benefit-Cost Assessment, in the Overview provides some details for the costs and benefits. It is telling that the numbers behind the $310 billion, $290 billion and $305 billion number labels of the columns in the figure are not available. The only representation of the breakdown of how those costs were apportioned across all energy sectors of New York is another graph. That makes providing meaningful comments nearly impossible and also, in my opinion, represents a deliberate attempt to obfuscate the cost calculations.
I have written several posts on Scoping Plan benefits at my blog over the last couple of months. Climate Act Scoping Plan Benefits summarized all the findings in those articles. I also prepared a white paper, Scoping Plan Costs and Benefits, that describes all the calculations and provides details.
In brief, the benefits are over-stated. The Plan describes health benefits totaling $165 to $170 billion due to improvements in air quality. Air quality has improved markedly since 2000 and the observed reductions from 2000 to 2019 are 16 times greater than the improvements projected for the Climate Act in the Scoping Plan. Until such time that the State can show benefit improvements from the observed air quality changes since 2000 are 16 times greater than the benefits claimed here, then I am dubious of the claim. The increased active transportation benefit of $39.5 billion is based on a “first-order approximation based on state-wide numbers” that translates to “we guessed a benefit ignoring the fact that this will claim could only occur in certain areas not the whole state”. As a result, the benefit estimate is far too high. Energy efficiency interventions benefits in low- and middle-income homes are claimed to total $8.7 billion but $2.4 billion of that is from non-energy interventions and should not be claimed as benefits for Climate Act GHG emission reduction programs.
The boast that the Climate Act has more benefits than costs is based on the claimed benefits for the avoided cost of GHG emissions that range between $235 and $250 billion. The Climate Act manipulates emissions to increase benefits and uses a lower discount rate than current Federal guidance resulting in societal benefits of GHG emission reductions that are 4.5 times higher for 1990 emissions and 5.4 times higher for 2019 emissions than other jurisdictions.
Calculation of Societal Benefits of Avoided Impacts for GHG Emission Reductions
All the aforementioned machinations and dubious attempts to inflate the benefits of the Climate Act so that the costs of inaction out-weigh the costs of action failed to get a positive number so the authors used an inaccurate method to calculate social cost of carbon benefits. This section explains how they cheated.
Slide 3, GHG Emissions Reductions, graphically shows current (2019) estimated GHG emissions, 1990 base year emissions and the targets in 2030 and 2050. Consistent with the lack of documentation for the cost figures, the calculation of the societal benefits numbers are unavailable. I could not reproduce the $235 billion to $250 billion estimates from the information available. I believe this represents a deliberate attempt to cover up the “on thin ice” calculations.

It does not matter to my point that the claim of positive impacts is bogus however. Figure ES.1 in the New York Department of Environmental Conservation (DEC) GHG inventory shows the annual statewide emissions from 1990 to 2019. DEC did not provide the actual numbers used to generate this graphic and you will forgive me for pointing out the obvious tendency to avoid any numbers that could embarrass the narrative. The only numbers provided are the 1990 baseline value of 402.54, the maximum in 2005 of 458.55 and the 2019 value of 379.43. All these values are in million metric tons of carbon dioxide equivalent in terms of GWP20.

For the sake of this argument, we can even ignore New York’s unconventional gaming of the value of carbon system that gives different numbers than any other jurisdiction. The only reference to values comparable to other inventories states “As a point of comparison, when applying the conventional, or UNFCCC, format for governmental accounting, emissions declined 21% percent from 1990 to 2019, or from a net emission rate of 210.43mmt to 165.46 mmt CO2e GWP100”.
The Social Cost of Carbon (SCC) or Value of Carbon is a measure of the avoided costs from global warming impacts out to 2300 enabled by reducing a ton of today’s emissions. We don’t even have to worry about the biases in the values of the SCC calculations used to show their claim is bogus. We know that the NYS GHG inventory numbers are the 1990 baseline value of 402.54, the maximum in 2005 of 458.55 and the 2019 value of 379.43 million metric tons of CO2 equivalent in terms of GWP20. We also know the New York values of carbon in the same unit of measure. If the Climate Act eliminates New York GHG emissions from any of the three values listed, the societal benefit is that emission total multiplied by the NY value of carbon. The state recommends using the 2% discount rate which gives societal benefits ranging between $46.7 billion and $56.4 billion using the 2021 values depending on which historical emission value is used.
Despite all the machinations the societal benefits in the Scoping Plan are not large enough to claim positive net benefits. The Scoping Plan games the system by relying on flawed DEC Value of Avoided Carbon Guidance. In the Guidance section entitled “Estimating the emission reduction benefits of a plan or goal” an example is included:
“The net present value of the plan is equal to the cumulative benefit of the emission reductions that happened each year (adjusted for the discount rate). In other words, the value of carbon is applied to each year, based on the reduction from the no action case, 100,000 tons in this case. The Appendix provides the value of carbon for each year. For example, the social cost of carbon dioxide in 2021 at a 2% discount rate is $127 per metric ton. The value of the reductions in 2021 are equal to $127 times 5,000 metric tons, or $635,000; in 2022 $129 times 10,000 tons, etc. This calculation would be carried out for each year and for each discount rate of interest.”
I believe that the guidance approach is wrong because it applies the social cost multiple times for each ton reduced. As shown above, using any of the observed total GHG emission values multiplied by a social cost number representing all the societal benefits if those emissions are reduced out to the year 2300 gives benefits between $46.7 billion and $56.4 billion. Using the DEC guidance comes up with benefits of between $235 billion and $250 billion. If only that error is corrected the total benefits range from negative $74.5 to negative $49.5 billion instead of net benefits ranging from $90 billion to $120 billion.
Conclusion
Despite their best efforts to game their numbers to claim that the cost of inaction exceeds the cost of action for the Climate Act New York State has to rely on obviously incorrect guidance. Using their lifetime approach someone who lost 10 pounds five years ago can claim that they lost 50 pounds. It is absurd and illustrates the lengths the supporters of the Climate Act will go to in order to get the “right” answer.
It is also telling that the Draft Scoping Plan and the technical documentation does not provide any numerical backup information for these societal benefits of GHG emission reductions or the cost projections. Cynics like me believe that indicates that they know their numbers are bogus.
There is nothing preventing anyone from commenting on the Draft Scoping Plan. Comments submitted now in New York may prevent some similar atrocity coming to your jurisdiction in the future so please comment.
—————————————————————————————————————————————
Roger Caiazza blogs on New York energy and environmental issues at Pragmatic Environmentalist of New York. This represents his opinion and not the opinion of any of his previous employers or any other company with which he has been associated.
via Watts Up With That?
January 31, 2022 at 08:43PM
On January 14, NPR and their climate experts predicted record low Great Lakes ice cover. Great Lakes researchers predict record-low ice coverage – Great Lakes Now One week later Great Lakes ice cover was above the 40 year mean for … Continue reading →
via Real Climate Science
January 31, 2022 at 07:48PM
Pack ice is barreling down the Labrador coast, almost certainly bringing Davis Strait polar bears with it. And according to new survey results, those bears are doing just fine: numbers are stable, bears are fatter than they were in 2007, and cubs are surviving well – thanks largely to abundant harp seals.

According to the summary, the 2017-2018 survey generated a population estimate of 2,015 (range 1,603-2,588), which is statistically indistinguishable from the 2005-2007 study estimate of 2,158 (range 1,978-2,338). Notice the range of potential error is much larger for the most recent estimate, which is a result of different methods used (Dyck et al. 2021; Peacock et al. 2013). No bears were captured and collared for the 2018 study (the full report has not yet been made public).

What’s interesting is that in 2007, the body condition of bears was noted to have been worse than it had been in the 1990s yet the population size had increased markedly (Rode et al. 2012). Now body condition of bears has improved but numbers have not increased.
I suggest that it’s quite possible the actual number of bears in the population is at least somewhat greater than the official estimate indicates: that the real number lies closer to the higher end of the estimated range rather than at the middle. Of course, that’s always the case because these estimates are based on counting a subsample of bears and extrapolating to the entire region using a mathematical model.
However, this is why other indicators are important. Good body condition and good cub survival indicate a population that’s in good shape. Similar indicators have been seen in the Barents Sea and Chukchi Sea subpopulations (Aars et al. 2017; Norwegian Polar Institute 2021; Rode et al. 2014, 2018).
Certainly, 2017 and 2018 stood out as having many more sightings of bears along the Labrador and northern Newfoundland coast than there were in 2007. In contrast, sea ice was extensive along that coast in 2007 yet there were no sightings of polar bears reported.
There were several sightings in 2008 and a spate of trouble in 2012 that resulted in a few bears being killed for safety concerns. Then in 2017 and 2018 – the same years of the most recent population survey – there were reports of many more sightings: at least nine in 2017 amid extensive ice and even more (12-18) in 2018 (Crockford 2020:34).
Labrador sea ice 2022
Big picture first:

Sea ice conditions this year show Davis Strait ice (light green) moving south rapidly against thinner, newly-formed ice (purple) along the coast.

Compare above to 2017, when the ice was very thick later in the season north of Newfoundland: thicker, first year ice from the north (light green) had replaced virtually all new ice along the coast.

Time will tell if the pack ice off Newfoundland in April will be as thick as it was in 2017 but at the moment, conditions are looking good for East Coast harp seals set to give birth to pups in March and the Davis Strait polar bears that come to feed on them.
References
Aars, J., Marques,T.A, Lone, K., Anderson, M., Wiig, Ø., Fløystad, I.M.B., Hagen, S.B. and Buckland, S.T. 2017. The number and distribution of polar bears in the western Barents Sea, Polar Research 36:1, 1374125.
Crockford, S.J. 2020. State of the Polar Bear 2019. Global Warming Policy Foundation Report 39.
Dyck, M., Dunham, K.D., Ware, J.V., Koons, D.N., Regehr, E.V., Hosmer, D.W., Derocher, A.E., Dale, A., Pisapio, J. and Szor, G. 2021. Re-estimating the abundance of the Davis Strait polar bear subpopulation by genetic mark-recapture. Final Report to Nunavut Wildlife Boards. Government of Nunavut, Igloolik, 17 December. Two page summary and title page provided by A.E. Derocher via Twitter https://twitter.com/AEDerocher/status/1473001033257218051; the entire final report had not yet been made public by the time this report was written.
Norwegian Polar Institute. 2021. Polar bear cubs per litter, number of females with cubs of different ages, and condition in adult polar bear males. Environmental monitoring of Svalbard and Jan Mayen (MOSJ), 8 September. http://www.mosj.no/en/fauna/marine/polar-bear.html
Peacock, E., Taylor, M.K., Laake, J., and Stirling, I. 2013. Population ecology of polar bears in Davis Strait, Canada and Greenland. Journal of Wildlife Management 77:463–476
Rode, K.D., Peacock, E., Taylor, M., Stirling, I., Born, E.W., Laidre, K.L., and Wiig, Ø. 2012. A tale of two polar bear populations: ice habitat, harvest, and body condition. Population Ecology 54:3-18. http://link.springer.com/article/10.1007/s10144-011-0299-9
Rode, K.D., Regehr, E.V., Douglas, D., Durner, G., Derocher, A.E., Thiemann, G.W., and Budge, S. 2014. Variation in the response of an Arctic top predator experiencing habitat loss: feeding and reproductive ecology of two polar bear populations. Global Change Biology 20(1):76–88.
Rode, K.D., Wilson, R.R., Douglas, D.C., Muhlenbruch, V., Atwood, T.C., Regehr, E.V., Richardson, E.S., Pilfold, N.W., Derocher, A.E., Durner, G.M., Stirling, I., Amstrup, S.C., St. Martin, M., Pagano, A.M. and Simac, K. 2018. Spring fasting behavior in a marine apex predator provides an index of ecosystem productivity. Global Change Biology 24(1):410-423.
via polarbearscience
January 31, 2022 at 07:25PM
