Month: January 2022

Pushing On String: Adding More Wind Turbines Doesn’t Mean More Power Gets Delivered

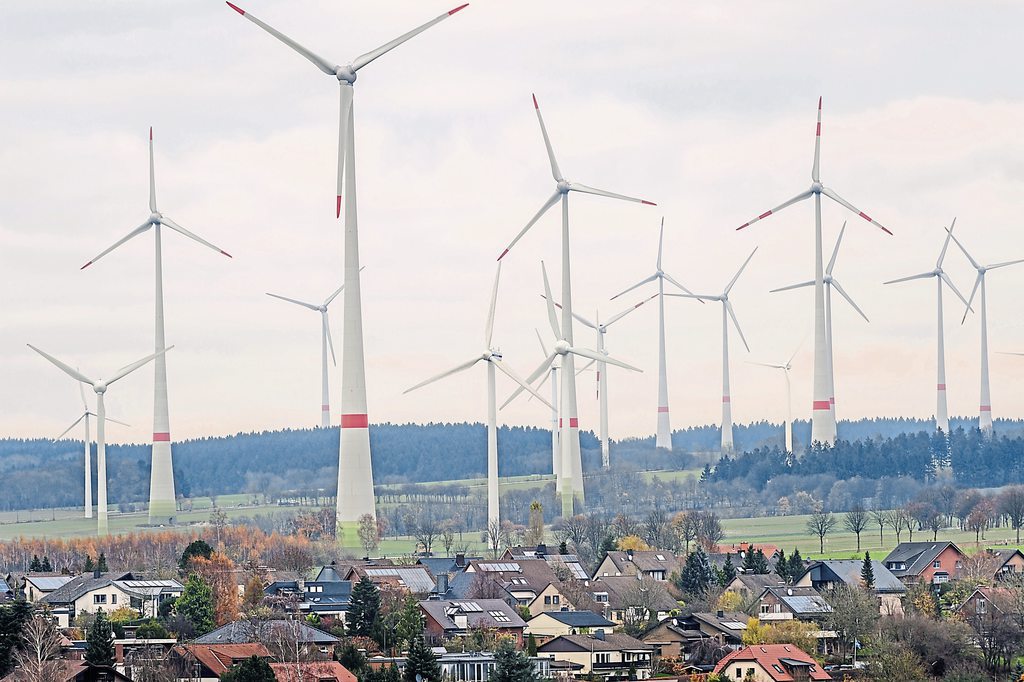
Wind power never adds up: it doesn’t matter how many turbines carpet your horizons, in calm weather total output always amounts to nothing.

For sheer density, the Germans win hands down, with more than 30,000 of these things carpeted across Deutschland’s rural landscapes and, once pristine, forests.

And yet, from late September, through October and well into November last year, wind power output in Germany often ranged between dismal and a doughnut.

Demonstrating that their delusional obsession with wind and solar runs deep, the Germans are determined to axe all of their nuclear and coal-fired power plants, and ‘replace’ the lost output with thousands more wind turbines and solar panels.

As to the former, as this little analysis by Professor Fritz Vahrenholt demonstrates, it simply doesn’t matter how many wind turbines Germany might eventually manage to squeeze into its landscape; when the wind stops blowing, the power stops flowing.

Germany’s New Government Plans To Use 10% Of Country’s Land Area For Wind Turbines 
No Tricks Zone
Prof. Fritz Vahrenholt (Text translated/edited by P. Gosselin)
12 December 2021

After the phase-out of nuclear energy at the end of 2023, the coalition agreement aims to bring forward the phase-out of coal, “Ideally, this already would be achieved by 2030“.

To this end, renewable energies are to take over 80% of electricity generation, which is to increase from 600 TWh (terawatt hours) today to 680-750 TWh (p.56). While concrete generation targets are named for solar energy (quadrupling of today’s capacity to 200 GW) and for off-shore wind energy (also quadrupling to 30 GW), the agreement only speaks of a target for on-shore wind energy of a land take of 2% of the country’s surface area.

If we were to talk about an increase of 30,000 turbines – and this can be assumed if the area doubles from today’s 0.9% of the land area – this would not go down so well in the countryside.

But is the 2% area really accurate? It is just as inaccurate as the figure of 0.9% for today’s land area. This is because the area figures refer in each case to the narrowly defined area covered by the B-Plan. The necessary distances to residential buildings are not included in this area figure. The 0.9% corresponds to 3100 km² today (source: Federal Environment Agency and Competence Centre for Nature Conservation and Energy Transition).

“1,325 square kilometres and thus approximately 42 percent of the areas considered – taking into account the existing installations as of the cut-off date December 31, 2017 – are free for the installation of wind turbines.” This means that there were 28,500 turbines on 1800 km² in 2017 (today there are 30,000 turbines). This is, as I said, the area of the B-plans. This area does not include the necessary distance to residential buildings, which, however, must be covered by planning.

If you divide the number of turbines (28,500) by the area (1800 km²), there are 16 turbines/km², i.e. an average of 62,500 m² per turbine or 250 m by 250 m. This shows that the necessary distance to residential buildings is not sufficient.

Six times the area
If we calculate an average size of 5 turbines per wind farm, the wind farm would cover an average area of 176,000 m² (420 m x 420 m with 4 wind turbines at the edges and 1 in the middle) without distance areas (at a distance of 300 m between the turbines). With a distance of 600 m (which is already questionable from the point of view of emission protection) to the nearest residential area, the park requires an area of 1020 m x 1020 m = 1.04 km². This is six times the area of the B-Plan area, which is merely nestled around the plant configuration.

Even if one takes into account that today 5% of the turbines are located in the forest (where there are no distance restrictions) and in the future perhaps 20% will be built in the forest, the area required would only be reduced to five times the B-Plan area.

In other words, those who demand 2% of the land area with B-plans for wind power plants actually need 10% of the land area.

Now it will be conceded that the size and height of turbines will increase significantly, so that we can expect less than 30,000 turbines. That is correct. But the land consumption will remain in the same order of magnitude, because larger turbines also need a greater distance between each other (5 times the rotor diameter, at 120 m that is 600 m distance).

Moreover, they need a distance of at least 1000 m from residential areas. The output increases, but so does the land consumption. The fact that a multiplication of wind energy does not result in a guaranteed output does not need to be mentioned again here.

Even the windy November showed that wind energy production was often enough close to zero to 5000 MW, and thus less than 10% of the possible output of 60,000 MW. And 3 times zero is zero.

No Tricks Zone

via STOP THESE THINGS

https://ift.tt/gs84zGokb

January 30, 2022 at 12:32AM

We Should Not Compare Electricity Sources Using Nameplate Ratings

Misleading are the public relations efforts intending to make people feel good about weather dependent electricity from wind and solar “taking root” and “replacing” traditional continuous uninterruptable means of making electricity.

By Ronald Stein  Ambassador for Energy & Infrastructure, Irvine, California

Tom Stacy Electricity System Analyst / Consultant, Ohio


Comparing nameplate ratings of various electrical generating powers sources is comparable to using IQ as the only or most appropriate measure of the value of an employee to the company he or she works for…  If everyone had the same health level, skillset, and work ethic, it might suffice.  But we don’t.  And neither do different kinds of power plants.

For those of us who focus on the costs and benefits of various kinds of power plants within a grid system, it appears there has been an orchestrated effort through media, advertising, and public relations – even government agencies – to mislead the public about the value proposition of wind and solar. 

One of the most glaring examples is the persistent use of “nameplate rating” (generating capacity) of breezes and sunshine as a benchmark of value and comparison.  Nameplate rating itself is not a reflection of the contribution of energy or reliability to a grid system.

In the 20th century “nameplate rating” was a reasonable proxy for contribution to meeting peak demand whenever that peak may occur.  Put another way, all prevalent power plant types could be turned on and run – up to their “nameplate rating” – whenever they were needed (aside from scheduled time for major maintenance or upon some small chance of unexpected breakdown) because they were able to manage their fuels.

For these tried-and-true technologies whose fuel availability is determined by human ingenuity and learning/adapting, it is common to de-rate nameplate rating by only about 10 to 15% to arrive at a “capacity value” or “system adequacy contribution” value (in reliable, on demand watts). This value for each power plant is added together across a system and the sum expected to meet maximum system demand (called peak load) with about ten to fifteen percent more as a “reserve margin” to avoid potential blackouts caused by unexpected generator outages or unexpected high demand.

The amount of reserve margin is a trade-off between the risk of black-outs (and other system reliability issues) and costs.  So “right sizing” system “adequacy” is important to keeping electricity rates low because power plants cost far more to build and maintain than all the fuel they will ever consume over their lifespans. Accordingly, too many power plants are indeed too many because they are expensive to build, and therefore they rely on adequate revenue from their productivity to pay for themselves and produce a return on investment over several decades.

A 90 percent System Adequacy Contribution per watt of Nameplate Rating is fair and common across conventional types from coal to gas to nuclear.  But wind and solar are different compared to technologies that have ‘Firm’ capacity.  Their “fuels,” solar radiation and breezes, cannot be managed – i.e., consistently delivered and converted to electricity – and will never be. This is especially critical at the times demand is greatest.  Therefore, they do not significantly replace the most expensive component of the cost of electricity: dispatchable power plants.  Instead, they sap market share, gross margin percentages and revenue from the dependable fleet they can only pretend they can replace.

Just as problematic as renewables’ fundamental inability to generate at highest demand times is that these “intermittent fueled generators” often generate most when less power is needed by society, creating an undervalued market price for all electricity producers – sometimes lower than it costs them to generate (known as marginal cost), and far lower than the all-in cost to maintain system adequacy considering loan payments, payroll and other monthly expenses which must be met by all power plants.

For wind and solar “nameplate rating” is neither a measure of expected electricity generation over time nor their contribution to system reliability. Yet time and time again we see government entities, grid operators and especially news media spouting GENERATING CAPACITY (nameplate rating) in comparisons with conventional generating technologies.

Using nameplate capacity to compare technologies is misleading people into believing that weather dependent electricity can “replace” technologies that can manage their fuels when they cannot. This kind of reporting and public relations is, intentionally or not, biased toward intermittent generation. It’s sad when done by the media and public relations, and worse when done by a government agency.

However, with respect to cost comparison, US Department of Energy EIA states it clearly in their annual levelized cost of electricity reports, imploring:

 “The duty cycle for intermittent renewable resources, wind and solar, is not operator controlled, but dependent on the weather or solar cycle (that is, sunrise/sunset)..(and so) their levelized costs are not directly comparable to those for other technologies..” ……………………………..              

PJM, the largest wholesale electricity market operator in the world seems to agree in this statement describing the priorities in their most recent renewables transition study: Correctly calculating the capacity contribution of generators is essential: A system with increased variable resources will require new approaches to adequately assess the reliability value of each resource and the system overall.”

This speaks directly to the importance of accurate system adequacy contribution comparisons between different generating technologies as the headline metric of value – instead of nameplate rating.

The correct two metrics of comparison between intermittent and dispatchable power plants that should supersede the use of nameplate rating are:

1) system adequacy contribution (in MWs) and

2) annualized electric energy generation (in MWhs)

Unfortunately, as PJM indicates, the methods of estimating system adequacy contribution are also controversial.  The most widely used metric is “the old approach”, or ELCC (effective load carrying capability).  That metric would be helpful if all generating technologies were symbiotic and not parasitic.  In other words, ELCC fails to consider that wind and solar readily depress the financial viability of the existing dispatchable fleet that renewables require to remain, and that ELCC uses as a basis for the calculation of the system adequacy contribution of the “parasitic” renewables!  In essence the metric isn’t well suited for an energy mix where competitive technologies aren’t direct substitutes for each other.  ELCC is subtly circular in its reasoning since renewables have become politically favored into deployment and undermine the financial solvency of dependable power plant investments. 

A better way of estimating system adequacy contribution looks at recent historical generating patterns of renewables in the context of the load patterns and amplitudes they might serve, independent of the existing generation mix.  We favor one called “Mean of Lowest Quartile generation across peak load hours (MLQ) suggested by the market Monitor in its 2012 SOM report on MISO. 

Realistically, by this metric, the following shows both nameplate capacity (outlined, not color-shaded) and system adequacy contribution (color-shaded) of the US electricity mix as of the end of 2018.

In using the wrong bases of comparison between power plant types, governments, market operators and image-obsessed companies are ignoring prudent economics and physics, placing the importance of the notion of a cleaner, self-sustaining world dependent on the weather for power ahead of real priorities like an affordable, abundant, and reliable electricity grid system, in accordance with FERC’s mission, to support human flourishing.

Renewables only “take root” because governments, market operators, utility regulators and misguided Environmental, Social and Governance (ESG) factors – misguided only in that they do not account for how the Grid actually works, as discussed above – seek an unrealistic pace and impetus of “energy transition.” These push modern civilization toward reaching an economy like we had in the 1800’s and prior – the last time the world was “decarbonized”. 

Ronald Stein, P.E.                                            Tom Stacy
Ambassador for Energy & Infrastructure       Electricity System Economist

http://www.energyliteracy.net/

via Watts Up With That?

https://ift.tt/RbypCd5vz

January 30, 2022 at 12:06AM

Controlling The Climate And Viruses

Scientific American endorsed Biden saying that a corrupt career politician suffering dementia would control viruses and the climate. Scientific American Endorses Joe Biden – Scientific American There is no indication that either Democrats or Republicans have any control over global … Continue reading

via Real Climate Science

https://ift.tt/g754q6BiX

January 29, 2022 at 11:24PM

UCL Professor: “Modelling climate change is much easier” than Weather

Guest essay by Eric Worrall

The diverse predictions produced by 20 major research centres represent “strength in numbers”, according to UCL Professor of Earth System Science Mark Maslin.

The diverse predictions produced by 20 major research centres represent “strength in numbers”, according to UCL Professor of Earth System Science Mark Maslin.

Mark Maslin
Professor of Earth System Science, UCL

It’s a common argument among climate deniers: scientific models cannot predict the future, so why should we trust them to tell us how the climate will change?

Deniers often confuse the climate with weather when arguing that models are inherently inaccurate. Weather refers to the short-term conditions in the atmosphere at any given time. The climate, meanwhile, is the weather of a region averaged over several decades.

Weather predictions have got much more accurate over the last 40 years, but the chaotic nature of weather means they become unreliable beyond a week or so. Modelling climate change is much easier however, as you are dealing with long-term averages. For example, we know the weather will be warmer in summer and colder in winter. 

Here’s a helpful comparison. It is impossible to predict at what age any particular person will die, but we can say with a high degree of confidence what the average life expectancy of a person will be in a particular country. And we can say with 100% confidence that they will die. Just as we can say with absolute certainty that putting greenhouses gases in the atmosphere warms the planet.

Strength in numbers

There are a huge range of climate models, from those attempting to understand specific mechanisms such as the behaviour of clouds, to general circulation models (GCM) that are used to predict the future climate of our planet. 

There are over 20 major international research centres where teams of some of the smartest people in the world have built and run these GCMs which contain millions of lines of code representing the very latest understanding of the climate system. These models are continually tested against historic and palaeoclimate data (this refers to climate data from well before direct measurements, like the last ice age), as well as individual climate events such as large volcanic eruptions to make sure they reconstruct the climate, which they do extremely well.

No single model should ever be considered complete as they represent a very complex global climate system. But having so many different models constructed and calibrated independently means that scientists can be confident when the models agree.

Errors about error

Given the climate is such a complicated system, you might reasonably ask how scientists address potential sources of error, especially when modelling the climate over hundreds of years.

We scientists are very aware that models are simplifications of a complex world. But by having so many different models, built by different groups of experts, we can be more certain of the results they produce. All the models show the same thing: put greenhouses gases into the atmosphere and the world warms up. We represent the potential errors by showing the range of warming produced by all the models for each scenario.

Read more: https://theconversation.com/three-reasons-why-climate-change-models-are-our-best-hope-for-understanding-the-future-175936

I have few problems with these arguments:

  1. Comparing climate models to life expectancy models in my opinion is a false comparison.

    Life expectancy models are constructed from millions of independent observations, medical records vs time of death. By contrast, climate scientists struggle to reconstruct what happened yesterday. There is a significant divergence between temperature reconstructions of the last 30 years, let alone climate projections.

    (source Wood for Trees)

  2. “Millions of lines of code” are not a source of confidence. Millions of lines of code are millions of opportunities to stuff up. As a software developer I’ve worked with physicists and mathematicians. They all think they know how to code, but with very few exceptions they wrote dreadful code.

    The problem I saw over and over was that mathematics and physics training creates an irresistible inner compulsion to reduce everything to the simplest possible expression, even when such reduction means ditching software best practices designed to minimise the risk of serious errors. I knew what to expect well before I read Climategate’s “Harry Read Me“.

  3. If the climate models were fit for purpose, scientists would only need one unified model. The fact there are many diverse models is itself evidence climate scientists are struggling to get it right. Compare this plethora of climate models to say models used to predict the motion of satellites. If satellite orbital predictions were as uncertain as climate projections, it would not be possible to create a global position system which can tell you where you are on the Earth’s surface to within a few feet.
  4. Climate models may contain major physics errors. Lord Monckton, Willie Soon, David Legates and William Briggs created a peer reviewed “irreducibly simple climate model“, which appears to demonstrate that most mainstream climate scientists use a grossly defective climate feedback model.

    In official climatology, feedback not only accounts for up to 90% of total warming but also for up to 90% of the uncertainty in how much warming there will be. How settled is “settled science”, when after 40 years and trillions spent, the modelers still cannot constrain that vast interval? IPCC’s lower bound is 1.5 K Charney sensitivity; the CMIP5 models’ upper bound is 4.7 K. The usual suspects have no idea how much warming there is going to be.

    My co-authors and I beg to differ. Feedback is not the big enchilada. Official climatology has – as far as we can discover – entirely neglected a central truth. That truth is that whatever feedback processes are present in the climate at any given moment must necessarily respond not merely to changes in the pre-existing temperature: they must respond to the entire reference temperature obtaining at that moment, specifically including the emission temperature that would be present even in the absence of any non-condensing greenhouse gases or of any feedbacks.

    Read more: https://wattsupwiththat.com/2019/06/08/feedback-is-not-the-big-enchilada/

    Lord Monckton’s point is, since feedback is a function of temperature, feedback processes can’t tell the difference between greenhouse warming and the initial starting temperature, all they see is the total temperature. You have to include the initial starting temperature alongside any greenhouse warming when calculating total feedback, you can’t just use the the change in temperature caused by adding CO2 to the atmosphere. Making this correction dramatically reduces estimated climate sensitivity, slashes future projections of global warming, and removes the need to panic about anthropogenic CO2.

  5. Cloud error. As Dr. Roy Spencer explains in a 2007 paper which supports Richard Lindzen’s Iris Hypothesis, clouds are potentially a very significant player in future climate change. Yet as scientists sometimes admit, climate models do a terrible job of explaining cloud behaviour. If climate models can’t explain major processes which contribute to global surface temperature, they are not ready to be used as a serious guide to future surface temperature.

Why are climate scientists so keen to have models accepted, why do they seem so ready to gloss over the shortcomings? The following quote from a Climategate email provides an important hint as to what might have gone wrong;

… K Hutter added that politicians accused scientists of a high signal to noise ratio; scientists must make sure that they come up with stronger signals. The time-frame for science and politics is very different; politicians need instant information, but scientific results take a long time …

Source: Climategate Email 0700.txt

In my opinion, political paymasters demanded certainty, so certainty is what they got.

Science needs people like Mark Maslin, who are confident and willing to defend their positions and models.

I’m not suggesting Mark Maslin is in any way following the money or acting in a way which is contrary to his conscience. If there is one thing which comes through very clearly in the Climategate emails, that is that the climate scientists who wrote them are utterly sincere.

What in my opinion broke climate science is the other side of this equation was all but eliminated. What I am suggesting is climate scientists who were not confident in their models and their projections mostly got defunded, via a politically driven brutal Darwinian selection process which weeded out almost everyone who wasn’t “certain”.

We can still see this happening today. Climate scientists who support politically approved narratives receive lavish funding, while those like Peter Ridd who question official narratives, not so much.

I’m not against climate models as such, I believe there is a chance, though not a certainty, that eventually we shall have a comprehensive model of climate change which can produce worthwhile projections of future climate. What I dispute is that most current climate models which tend to run way too hot are fit for purpose. In my opinion, climate models should be regarded as a work in progress, not an instrument which is useful for advising government policy.

via Watts Up With That?

https://ift.tt/EiVLSpWy8

January 29, 2022 at 08:48PM