
By Paul Homewood

A slide show that Prime Minister Boris Johnson says helped convince him on climate change has been revealed for the first time.
The slides used to "teach" him about climate science have been released after a Freedom of Information request by UK climate website Carbon Brief.
While Mr Johnson has urged action on climate change, he previously, as a journalist, expressed scepticism.
He called the presentation, given just after he took office, "very important".
The "teach in", as it was described in email correspondence, took place in the Cabinet Room of Number 10 Downing Street on 28 January 2020.
It was organised by the office of Sir Patrick Vallance, the government’s chief scientific adviser.
The briefing consisted of 11 slides showing key aspects of climate science and its impacts and the presentation was led by Prof Stephen Belcher, the chief scientist at the Met Office.
https://www.bbc.co.uk/news/science-environment-60203674
These are the slides, with my comments below:
SLIDE 1

COMMENT
It is immediately apparent that global temperature rise began around 1900, long before emissions began their rapid rise. There was also a period from 1940 to 1980, when temperatures fell, despite rising emissions. This should be enough to prove that CO2 is not the only factor.
There is no mention at all of the Little Ice Age, the coldest era since the ice age, or discussion of how much of the 20th warming may be a natural recovery from that.
The graph on sea levels is perhaps one of the most dishonest ones, as it begins in 1993, giving the impression that sea level rise is some sort of modern phenomenon.
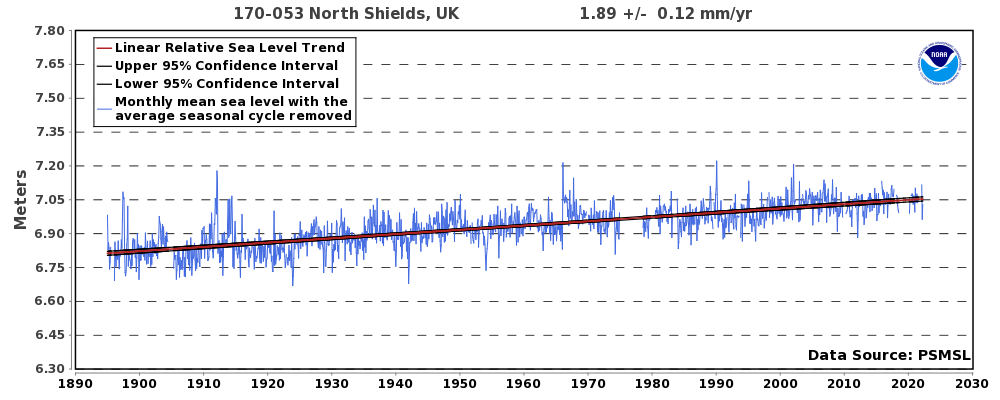
Why did not Belcher show the PM this chart, confirming that sea levels have been rising since the mid 19thC, with no acceleration? This is the strongest evidence that CO2 is not a major factor in global warming:

https://notalotofpeopleknowthat.files.wordpress.com/2018/05/jevrejevaetal2013gpchange.pdf
SLIDE 2

COMMENT
What an utter load of nonsense Johnson was subjected to by the climate “experts.” Using climate models to “simulate” what global temperature would have been without human influence is pure speculation.
Models are not “evidence”. And where are the charts which illustrate how computer modelled projections of warming are consistently much greater than observed?
SLIDE 3

As even the Met Office graph clearly shows, Arctic sea ice extent has actually been stable since 2007. This makes a total nonsense of the ridiculous headline “A tipping point”.
SLIDE 4

They show a rising trend in hot days, but why is there no chart showing the fall in cold days? When the latter are factored in, there are not “more extremes” now.
As for rainfall, it is generally accepted that a warmer world is also wetter, which in most regions would be regarded as a very good thing. A closer look at the map brings this into focus:

The areas mainly affected by heavier rain include the US Midwest, Western Australia, Amazonia, India and China, all of which used to suffer regularly from severe drought.
Ask an Iowa farmer or an Indian peasant whether heavier rain is a good or bad thing!
We also know from HH Lamb that global cooling in the 1960s and 70s led directly to the catastrophic Sahel droughts and monsoon failures in India.
SLIDE 5

This really is a childish attempt to scare the PM.
There is no evidence that any of these “impacts” are getting worse because of global warming. Even the IPCC admit that there are no significant trends in flooding.
I notice that curious claim by the Met Office that extended periods of heavy rainfall in winter are 7 times as likely. However the actual data in England shows this to be nonsensical:


Wildfires used to be much worse in the past, and human health is better than it ever has been.
Take malaria for instance. Death rates have fallen by a third in the last twenty years, “despite global warming”:

As for biodiversity, the natural world has a lot more to worry about than climate.
SLIDE 6

Pure make believe. There is no chance at all of a 5C temperature rise. And claims about extreme weather and other impacts are not supported by evidence.
SLIDE 7

Again, this is model output, not evidence. No allowance is made for natural warming post Little Ice Age. But what is evident even from this graph is that the alarmist projections of warming, as already used in earlier slides, are not remotely credible.
SLIDE 8

We’re back to sea levels again, with a UK focus. So why aren’t are the UK tidal gauges exhibited? Could it be that they don’t support the Met Office’s alarmist agenda?
SLIDE 9

This clearly shows that temperature rise has been consistently at the bottom end of projections, other than during El Ninos.
Since 2019 when the chart was calculated, global temperatures have declined by 0.13C (2021 is marked as X), taking the observations right out of the projections shown as the blue band.
SLIDE 10

As with Slide 7, this chart explains much better than I can exactly why the baseline projections of global warming are half-baked.
We must remember that all of the modern day obsession with climate – the UNFCCC, all of the COPs, Net Zero targets, and above all the desire to impoverish us all – is predicated on those same forecasts of apocalyptic warming.
SLIDE 11

We’re in Day After Tomorrow territory here, all of course without any basis in fact. And we have been here before, having somehow survived all of the other prophecies of doom and catastrophe made in the past.
The simple reality is that the planet has been warmer than now for most of the millennia since the ice age, yet these tipping points never occurred. There was no runaway warming. Indeed the climate actually cooled, most notably in the Little Ice Age.
FINAL THOUGHTS
The slide show was organised by Sir Patrick Vallance, which hardly gives you much confidence!
But worse still it was presented by the Met Office’s Stephen Belcher.
The Met Office long ago gave up any pretence of objectivity where global warming is concerned, always positioning itself at the extreme end of the debate.
To ask them for advice is akin to asking Greenpeace.
via NOT A LOT OF PEOPLE KNOW THAT
February 3, 2022 at 09:00AM
