
Guest “Not the net-zero they were looking for” by David Middleton
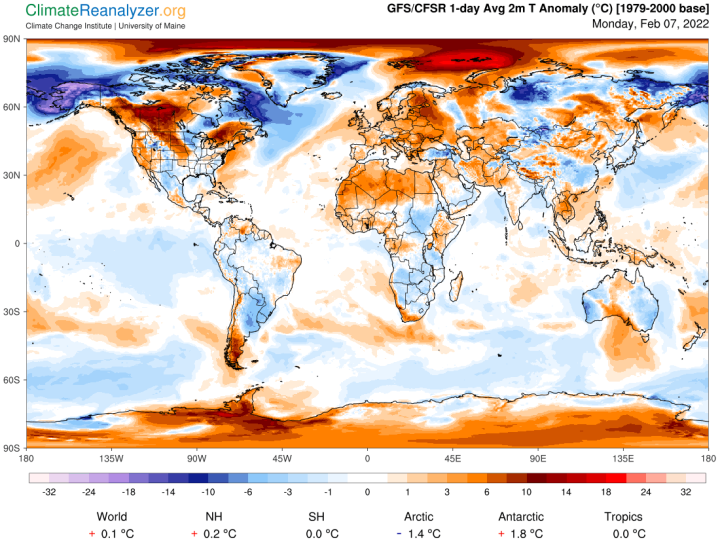
One of my LinkedIn connections posted a very interesting map yesterday:
Using a baseline of 1979-2000, the global temperature anomaly on Saturday was…
The map is from the University of Maine’s ClimateReanalyzer.org. Today’s “climate” is a mere 0.1 °C above “normal” (normal is in quotation marks for a reason 😉)…
ClimateReanalyzer.org is a pretty interesting website and appears to be a useful addition to our climate data “tool kit”. Here’s an example of the sort of “fun” you can have with this:
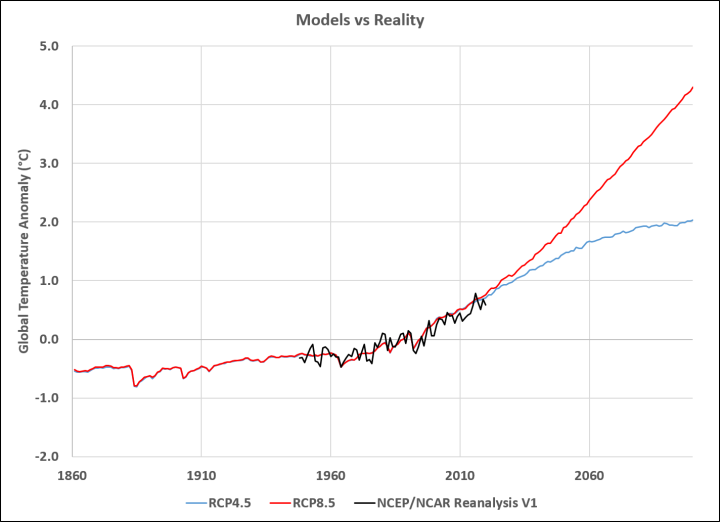
According to Schwalm et al., 2020, cumulative CO2 emissions are tracking the bad science fiction RCP8.5 scenario, while the temperatures are tracking below RCP4.5 “stabilization scenario”…
The RCP 4.5 scenario is a stabilization scenario, which means the radiative forcing level stabilizes at 4.5 W/m2 before 2100 by employment of a range of technologies and strategies for reducing greenhouse gas emissions.
When will they figure out that they have seriously overestimated the climate sensitivity to CO2?
Oddly enough, UAH 6.0’s latest monthly temperature anomaly relative to its 1991-2020 baseline period is also barely above the Dean Wormer line at +0.03 °C.
The global temperature departure from average in January fell from December to what is essentially zero, at +0.03 °C (+0.05 °F). Equatorial cooling associated with the on-going presence of La Niña continued and the tropics are now substantially below the 30-year average at -0.24 °C (-0.43 °F). As is often noted on these reports, the maximum cooling effect of La Niñas usually occurs sometime from February to May. The latest on this La Niña event can be found here.
The really funny thing is that despite nearly 50 years of “catastrophic” climate change emergency crisis, it’s less than 1.0 °C warmer now than it was when “The Ice Age Cometh”…
Even if anthropogenic CO2 emissions are actually the cause of all of the warming since 1975…

Being a bit warmer than “The Ice Age Cometh” should be viewed as a good thing… Shouldn’t it?
Of course, the modeled “natural” factors and forcings are strictly limited to what the modelers understand about “natural” factors and forcings.
P.S. If I have to tell you when I’m being sarcastic, it takes all of the fun out of sarcasm.
References
Schwalm, Christopher R., Spencer Glendon, Philip B. Duffy. RCP8.5 tracks cumulative CO2 emissions. Proceedings of the National Academy of Sciences Aug 2020, 117 (33) 19656-19657; DOI: 10.1073/pnas.2007117117
Terando, A., Reidmiller, D., Hostetler, S.W., Littell, J.S., Beard, T.D., Jr., Weiskopf, S.R., Belnap, J., and Plumlee, G.S., 2020, Using information from global climate models to inform policymaking—The role of the U.S. Geological Survey: U.S. Geological Survey Open-File Report 2020–1058, 25 p.,
https://ift.tt/dvHLZXC.
via Watts Up With That?
February 7, 2022 at 08:04PM
