
Weekend Unthreaded
0 out of 10 based on 0 rating
via JoNova
April 15, 2022 at 09:06AM
0 out of 10 based on 0 rating
via JoNova
April 15, 2022 at 09:06AM
By H. Sterling Burnett -April 14, 2022
Originally posted at ClimateREALISM
Dozens of corporate media outlets published stories claiming anthropogenic climate change caused 2020’s hurricane season to be “wetter,” with more rain falling in shorter periods of time than would have occurred naturally. Data indicates this is false. The stories were all based on a single “attribution,” study in Nature Communications. The study is impossible to verify since it is based on computer models simulations of the past and future, not measurements of past rainfall amounts over the time period specified in the study.
The New York Times, the Associated Press (AP), CNN, the Washington Post, and ABC News, are among dozens of corporate and trade media outlets, that published stories in recent days highlighting the reported results of a single study published in Nature Communications which claims to be able to attribute higher rainfall totals that fell during the active 2020 hurricane season to human caused climate change.
According to the authors of the study, titled “Attribution of 2020 hurricane season extreme rainfall to human-induced climate change,” “human-induced climate change increased the extreme 3-hourly storm rainfall rates and extreme 3-day accumulated rainfall amounts during the full 2020 hurricane season for … hurricane strength storms … by 11 and 8%, respectively.”
The AP’s coverage of the study was typical of the corporate media’s reports in general. In a story, titled “Pouring it on: Climate change made 2020 hurricanes rainier,” writer Seth Borenstein said, “Climate change made the record-smashing deadly 2020 Atlantic hurricane season noticeably wetter, a new study says. And it will likely make this season rainier, too, scientists said.”
All that’s missing from the media’s coverage of the report is context and hard data.
Concerning context, the attributed increase in excess rainfall from hurricanes during the 2020 season reported in the Nature study is based solely on computer model simulations, including simulations hindcasting the amounts of rainfall that would have been expected to occur during past hurricane seasons with and absent human enhanced greenhouse gas emissions. Three hour rainfall rates and accumulated 3 day rainfall totals weren’t measured for past hurricanes, and although comparable data from more recent hurricane seasons was available, it wasn’t used as a basis of comparison either.
Instead of data, the researchers used The Community Earth System Model (CESM) Large Ensemble, consisting of multiple models and numerous model runs (simulations) for hurricanes dating back to 1850. These hindcasts were built on numerous assumptions including limited solar impact on climate, assumptions about past sea surface temperatures, and estimates of carbon dioxide concentrations. They ignored all other natural and human factors that might impact temperatures and global and regional climate changes. Then, using the extreme Representative Concentration Pathway 8.5 (RCP8.5) to simulate carbon dioxides forcing on temperatures, they ran their models to produce estimates of what rainfall totals would have counterfactually been in the past and in 2020, with and absent human greenhouse emissions. They then compared the counterfactual results to the rainfall amounts measured during the 2020 hurricane season, and attributed the difference to human activities.
This is an extreme instance of the computer science and mathematics concept, GIGO: Garbage In, Garbage Out.
That general circulation climate models have serious failings is widely known. There is a significant debate concerning what factors influence global temperatures, as well as, for any particular factor, what direction and to what extent they influence temperatures. Those who have developed climate models admit they don’t understand the role that clouds or large scale ocean circulation patterns play in driving climate change, for example. As a result of this and other currently little understood factors which influence temperatures, rainfall patterns, and the like, as discussed in Climate at a Glance: Climate Sensitivity, mainstream calculations for a doubling of atmospheric carbon dioxide range from eight-tenths of a degree Celsius warming to almost 6 degrees C of warming by 2100.
As discussed in a Climate Realism post, here, two recent peer reviewed studies found a large degree of bias towards warmer projections, and that the CMIP5 models warm 4 to 5 times faster than actual observed temperature data. McKitrick and Christy (2020) write in “Persuasive warming bias in CMIP6 tropospheric layers” that “[W]e see no improvement between the CMIP5 and the CMIP6 models.”
Indeed, in July 2021 the journal Science published an article noting “climate scientists face this alarming reality, the climate models that help them project the future have grown a little too alarmist. Many of the world’s leading models are now projecting warming rates that most scientists, including the model developers themselves, believe are implausibly fast.
The researchers then compounded their error of relying on admittedly flawed computer models as a basis for attributing changes in hurricane rainfall patterns by using the most extreme climate scenario generated by those models, RCP8.5. Research demonstrates the world hasn’t been on the RCP8.5 path, since before it was first generated by climate models. More recently, Climate Realism highlighted two scientific papers demonstrating that RCP8.5 future climate scenarios can’t occur. There simply isn’t enough fossil fuel in existence on the planet to make it happen.
The attribution claims made in Nature Communications are also not supported by available hurricane data. Despite 2020 being an active hurricane season, long-term data show no increase in the number or intensity of hurricanes in the North Atlantic.
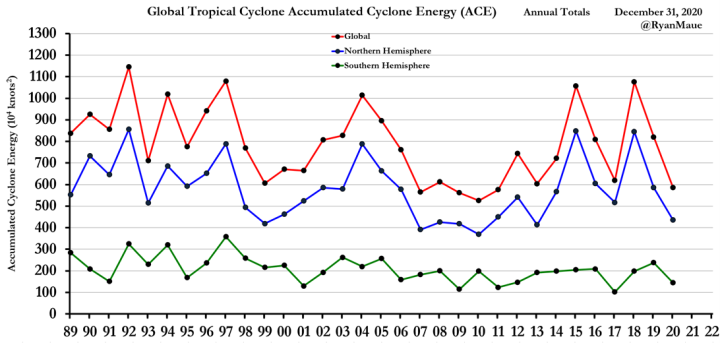
As pointed out in Climate Realism, here, data assembled by Ryan Maue, Ph.D., formerly the chief scientist the National Oceanic & Atmospheric Administration (NOAA), shows Accumulated Cyclone Energy from hurricanes in the United States has not increased, as shown in Figure 1 below. Nor, as Figure 2 shows, has the number of major hurricanes striking the United States increased.

Indeed, as discussed in Climate at a Glance: Hurricanes, NOAA’s records show the United States recently went through its longest period in recorded history without a major, Class 3 or above, hurricane strike, and America also recently experienced its fewest total hurricanes in any eight-year period. Repeated reports by the U.N. Intergovernmental Panel on Climate Change (IPCC) also indicate it has found no evidence human activities are changing hurricane patterns. In its 2018 interim report, the IPCC stated there is “only low confidence for the attribution of any detectable changes in tropical cyclone activity to anthropogenic influences” (Emphasis mine). Similarly, in its AR6 WG1 report, released in August 2021, the IPCC wrote, “[i]dentifying past trends in TC [tropical storm] metrics remains a challenge.” The IPCC went on to say it could not conclude hurricane trends had changed or that it could attribute any effect on hurricanes to human activities. So much for any claim that science shows human caused climate change is supercharging storms in the North Atlantic.
In the end, virtual worlds aren’t real worlds. With the current limited state of knowledge, attribution studies are sideshow carnival crystal ball gazing, tea leave reading stuff, not serious scientific research. Watts Up With That has published multiple papers examining the inherent weaknesses and failings of climate “attribution” studies.
Basing claims of past and future hurricane rainfall amounts on computer models which don’t even accurately replicate past or present temperatures or temperature trends, the most basic projection they make, is foolish. Compounding that error by using a climate scenario that is actually impossible, is even worse. Neither factor should have instilled enough confidence in mainstream media outlets to tout the alarming rainfall claims made in this single Nature Communications study, absent outside verification. Available data provide no support for the claim that climate change is causing hurricanes to become more frequent, more powerful, or that it is causing them to dump more rainfall. Even the IPCC says so.
H. Sterling Burnett, Ph.D. is managing editor of Environment & Climate News and a research fellow for environment and energy policy at The Heartland Institute. Burnett worked at the National Center for Policy Analysis for 18 years, most recently as a senior fellow in charge of NCPA’s environmental policy program. He has held various positions in professional and public policy organizations, including serving as a member of the Environment and Natural Resources Task Force in the Texas Comptroller’s e-Texas commission.
via Watts Up With That?
April 15, 2022 at 08:50AM

German hydrogen train [image credit: Euractiv]
The issue is leakage. In any case the notion of part of the supposed cure for ‘climate change’ being worse than the supposed disease is ironic. Germany imagines a future of so-called climate neutrality, a concept lacking any real-world meaning.
– – –
German Economy Minister Robert Habeck plans to import hydrogen from all over the world to satisfy Germany’s hunger for energy despite a new study questioning the climate-friendliness of hydrogen transport, EURACTIV Germany reports.
One thing is clear to all politicians and experts: Germany is an energy importing country.
To move towards climate neutrality, the German government wants to rely primarily on importing hydrogen molecules from all over the world – efforts which have been further accelerated due to the war in Ukraine and Germany’s dependence on Russian energy imports.
The idea is to split water with the help of renewable electricity, then ship the hydrogen to Germany and use it as a raw material and energy source for German industry. For this, Habeck most recently announced a hydrogen partnership with the United Arab Emirates.
The establishment of global “hydrogen supply chains” would serve the “achievement of our climate goals and at the same time our energy security”, Habeck said on 21 March.
The “Berlin Energy Transition Dialogue” at the Foreign Office at the start of April also focused on the global hydrogen economy. Representatives of governments from around the world agreed to initial contracts with each other as well as with German representatives to supply hydrogen.
The global hydrogen trade is supported by the German government foundation H2Global, which will underpin the trade in the gas with €900 million from the national treasury.
Doubts about decarbonisation
Whether hydrogen, which is supposed to decarbonise industrial processes as well as shipping and aviation, will deliver what it promises, however, is now in doubt.
This is because hydrogen could be a lot more harmful to the climate than initially believed, especially if it were to escape and enter the atmosphere before being used.
“We estimate the hydrogen GWP(100) to be 11 ± 5; a value more than 100% higher than previously published calculations,” the UK government study, commissioned by the UK’s Department for Business, Energy and Industrial Strategy, writes.
The GWP, or global warming potential, measures the relative contribution that various chemical compounds make to the greenhouse gas effect. Based on CO2, the GWP shows how much worse gases like methane or the now banned chlorofluorocarbons are for the climate.
This would mean that hydrogen is at best six times worse for the climate than CO2 over a period of 100 years. In the worst-case scenario, hydrogen could even prove 16 times more harmful than the widespread greenhouse gas.
Accelerating climate change
According to the study, hydrogen would also contribute significantly to climate change, even within a 20-year time frame.
Full article here.
via Tallbloke’s Talkshop
April 15, 2022 at 06:33AM
I wanted to make a toy model of an electricity grid, to shed some light – at least in my own mind – on some of the issues that arise when a reliable generator is displaced by an intermittent one. Skip straight to the last section if you are allergic to maths.
The baseline is extremely simple. We live in a place called Utopia, where our energy needs are met by a generator called Mr. Reliable. Mr. R supplies a constant power R to the grid, fulfilling all its needs, so R is also the grid capacity. [By way of simplification, there is no hourly variation in demand.] Mr. R is owned by the public, and burns hydrocarbons. His costs, and ours, are
KR + FR
K is Mr. R’s operating costs, Barons per GW per year
R is Mr. R’s capacity (for simplicity he operates at a capacity factor of 1).
F is Mr. R’s fuel cost in Barons per GW year
So far so good. Now into Utopia comes the urgent need to wean our country off its fossil fuel addiction. The new generator is also publicly owned, and his name is Mr. Intermittent. (He isn’t intermittent yet, but still). Mr. I’s costs, and ours, are:
LI
L is Mr. I’s operating costs, Barons per GW per year
I is Mr. I’s capacity
Mr. I has no fuel costs to pay. The fuel saved by adding Mr. I to the grid is:
cFI
c is the capacity factor of Mr. I.
So our new cost for the grid, having added Mr. I, is:
KR + FR + LI – cFI
If cFI > LI we have made a saving, or more simply if cF>L.
So if the operational costs of the new generator Mr I are less than his capacity factor times the per-unit cost of fuel he is displacing, we have saved both carbon emissions and money. Now let Mr. R’s actual generation, after Mr. I’s introduction, be A. His costs are now:
KR + FA
Where FA = FR – cFI. To displace all fuel, A must reach 0, which happens when R = cI. This is pretty obvious since for example if c = 0.4 [typical of an offshore windfarm], then R = 0.4I, so you need 2.5 times the capacity of Mr. I to replace Mr. R if Mr. I operates at 40% capacity factor.
The above holds true for the toy model if Mr. I is not intermittent at all, but goes flat out at capacity factor c. When R = cI, what happens in a slightly more realistic world is that half the time Mr. I produces too much power, and half the time he produces too little. Now, c represents not a constant capacity factor, but its average. So that at times when R > cI we have to ask Mr. R to turn back on, and when R < cI we are throwing energy away.
What happens at this stage depends entirely on the distribution of c. I’m taking an extreme example because it’s easy: c is a uniform random variable in the range [0…1] with mean 0.5.
Under this scenario, if Mr. I’s nominal capacity is twice Mr. R’s, I = 2R, and cI > R half the time; half the time Mr I generates more than R, half the time less than R. So half the time Mr. R has to turn on, anywhere from a little bit to full whack. The other half of the time Mr. R is turned off and power is being binned.
For the half of the time Mr. R is turned on, his output averages 0.5R, so that his overall output in the brave new world is 0.25R. For the half of the time power exceeds demand, we are throwing away an average of 0.5R, for an average wastage of 0.25R. Obviously these two things don’t happen at the same time, but all the time, one or other is happening: either Mr. R is turned on, or we’re throwing power away. And we can’t get rid of a watt of Mr. R’s generating capacity, for very occasionally he’s called upon to turn the wick up to full. Thus with twice the intermittent capacity added to the existing reliable capacity, we are still using a quarter of the amount of fuel we did before, and have all of Mr R’s generation still plugged in.
Our costs are now
KR + 0.25FR + 2LR
So we have made a saving if 0.75FR>2LR or if 3F>8L.
Determined as we are to get rid of fossil fuels entirely, running a grid of 3 times the previous capacity and still using a quarter as much fuel is unacceptable. The wisest minds of Utopia propose a new solution: storage.
Mr. R is retired, or as they say in Utopia, blown up by important people to the cheers of hoi polloi. Mr. I still has capacity 2R and produces as for the previous example, his capacity factor an unstructured random variable in the range [0…1], mean 0.5. Remember, half the time we are producing too much, and half the time too little. This implies that all we have to do is to draw on the big battery in times of need, and pay it back in times of plenty. It’s a nice little overdraft facility.
In terms of power, our backup has to be able to cover our needs, i.e. to produce power R. Now I’m going to put some fake numbers in for illustrative purposes. R, the grid power, is 100 GW flat out all the time. Our storage is going to be able to output that for 10 hours, so its capacity is 1000 GWh. For simplicity there is no energy lost in the process.
So the wise minds sit back and relax, knowing they are covered for power and have rid themselves of the dreaded fossil fuel addiction at last. Are they right?
Begin simulation…
Whoops, no they’re not. Beginning fully brimmed with 1000 GWh in the bank, in the first 500 hours we have hit zero storage and power cuts on ten occasions. But before we ran out of energy altogether we did manage to cap out the storage 6 times. Of course we had nowhere to put the excess at these times so the energy was thrown away. The top figure shows the power Mr I produced each hour (GW). The bottom one shows the energy stored in the big battery (GWh).
This is just one run, but it is as they say in the literature a “representative” example. The average capacity of the series was 0.491. 915 GWh was thrown away when storage was capped out. Actually, of ten runs with this scenario, 8 had power cuts.
Remember if Mr. I was a constant friend and ran at a continuous capacity factor of 0.5 (=100 GW) we would never need Mr. Storage at all.
But perhaps unstructured noise is an unfair test. What about if there is some persistence in Mr. I’s power output? In this example, half of Mr. I’s output depends on the previous value. As before the top figure shows Mr. I’s power output, and the bottom figure shows the energy we have in storage. In this run, storage maxed out 18 times and we had 5 power cuts. Average capacity factor was 0.514. Energy wasted when the storage was brimmed was 1898 GWh.
Power cuts also occur with different scenarios like a bounded random walk with 0.75 of the power dependent on the previous value. Below this situation is illustrated, and here we had 8 power cuts and we threw away 14323 GWh of energy.
So things look bleak for a storage solution, at least in Utopia. Note: The big battery in Hornsdale Australia offers 150 MW/ 193 MWh, and cost A$ 172,000,000. [That’s about a hundred million quid. The cost of the Utopian battery would therefore be about half a trillion quid – that’s 7.1 Barons in Utopian currency.]
Let’s rewind a bit. A minute ago Mr. R was still with us and he was reduced to running at an average of 0.25 of his capacity, thanks to the addition of Mr. I’s generation. Remember, in this scenario Mr. R cannot be got rid of, but has to stand dutifully by for whenever Mr. I is in the doldrums. At the moment this is all fine, although probably quite expensive.
Our costs are
KR + 0.25FR + 2LR
In Utopia where everything is cross-subsidised, we can afford to prop up Mr. R. What about if we inject a little capitalism?
At the beginning, Mr. R’s costs were
KR + FR
And he would be able to cover those costs with sales of R.
But now his costs are
KR+FA, (A being the actual power delivered) which in this case equals KR + 0.25FR
And he can only pay his way with sales of A = 0.25R. The price per unit of power needed to cover costs is (KR + FA)/A, or (KR/A) +F.
You’ll note that if the unit price depends on dividing by the quantity supplied, then as A goes down, the unit price goes up. And as A–> 0, the unit price approaches infinity. This is not surprising as at this stage Mr. R has to cover his costs on an infinitesimal quantity of sales.
What, you may ask, does all this mean? The model is necessarily overly simplistic, but it illustrates the problems of introducing an intermittent generator to a stable grid. In particular what it appears to show to me is that, the more power you get from the intermittent generator, the worse things get. In my first example, with a large amount of random generation and reliable backup, all of the reliable backup had to remain online, and it was still supplying a quarter of the grid’s power.
The storage model showed that even ten hours of flat-out power as stored energy was insufficient to buffer the new intermittent grid once all the reliable generation had been blown up. (That’s an implausible quantity of backup, I think.)
The last bit of maths made the point that, if you have to retain the reliable generator’s capacity, but it is increasingly under-utilised thanks to overcapacity of the intermittent generator, then in a capitalist world the reliable generator has to charge more and more for the power that it is called upon to deliver if it is to break even. In a reverse auction where the last generator to enter sets the price for all, this would be a recipe for very expensive electricity.
via Climate Scepticism
April 15, 2022 at 06:20AM
