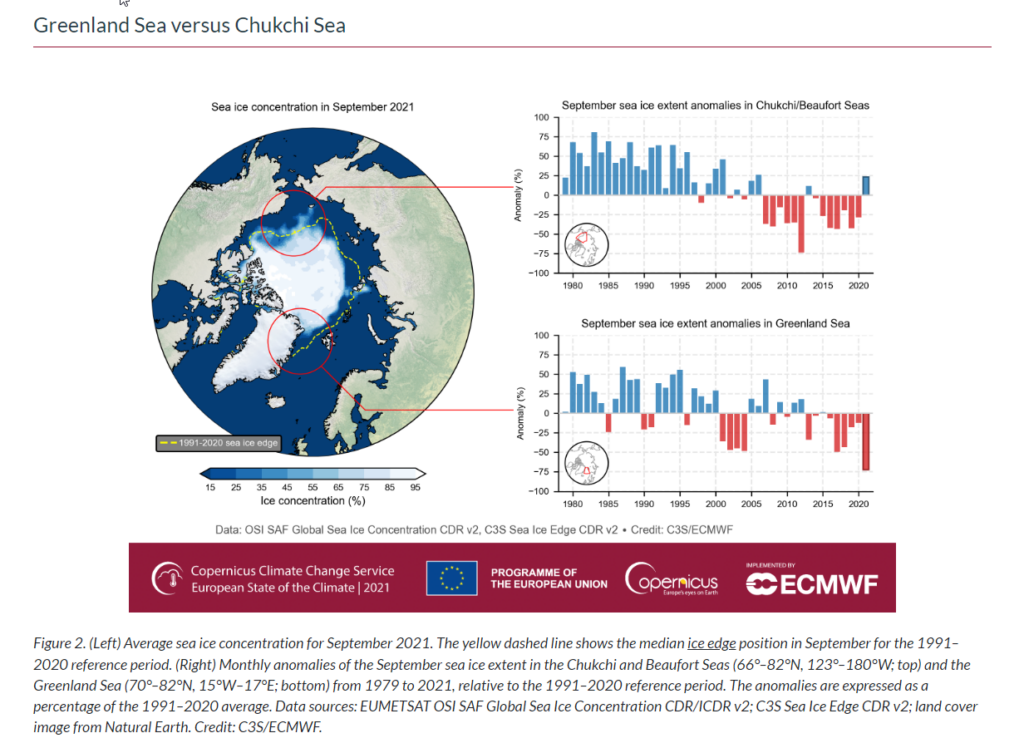
While sea ice has been declining off the Greenland Sea (east of the island), the Chucki Sea (eastern Siberia) shows a very different trend in sea ice extent over the past year. Such deviations have occurred repeatedly since the year 2000.
Chart: Screenshot climate.copernicus.eu
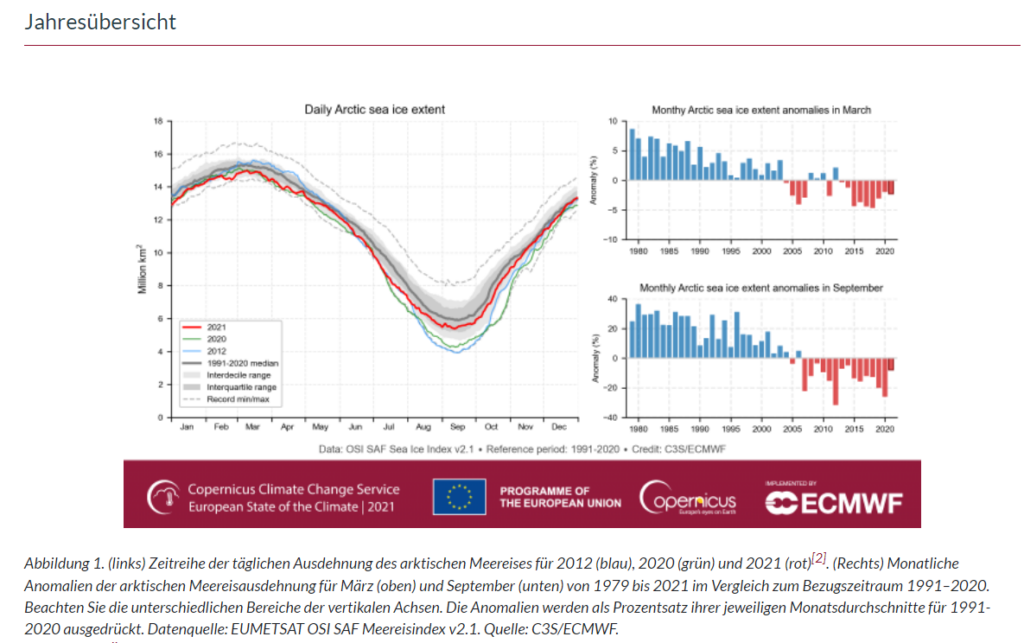
Overall, the 2021 extent was very close to the 1991-2020 mean and well above the lowest value in 2012 and also above what was recorded in the year 2020.
Chart: Screenshot climate.copernicus.eu
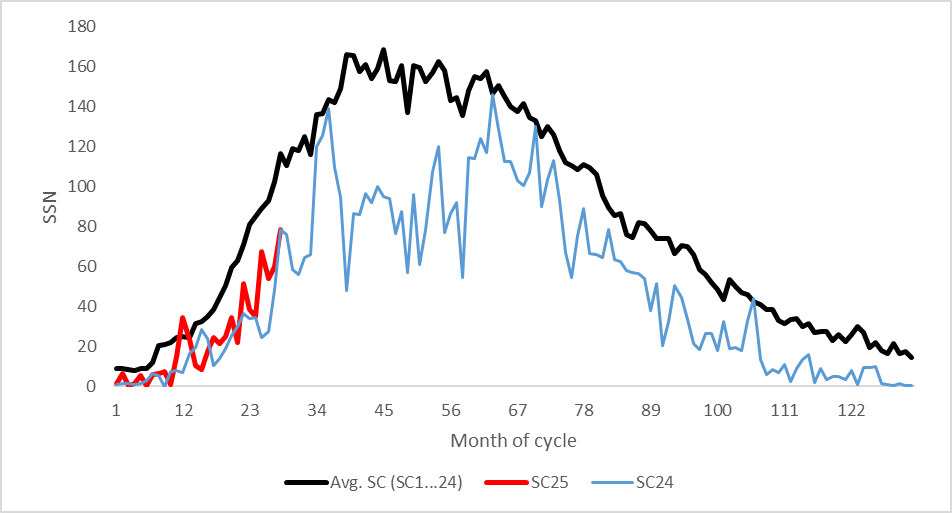
Solar Cycle 25
Solar Cycle 25 is now already 28 months old and there are still 12 months of sunspot activity increase to plateau on average for cycles 1…24, a little more than 3 years after the start of the cycle. So it’s worth taking a look at the current status of SC25, which started in December 2019.
It has been speculated that SC25 will be somewhat stronger than its predecessor SC24, which was the weakest cycle since the beginning of the 20th century. In fact, the current cycle so far behaves quite similar to SC24, in the sum of all months it showed only 21% more in SSN than the predecessor, it is thus “second last” in activity since 1900. We will inform you in irregular intervals about the status in the current solar activity, so far SC25 keeps to the forecasts.
“Leslie is accusing Project Veritas of publishing “misrepresented” audio of what she said in Twitter’s all-hands meeting. Is Leslie aware that we published the FULL RAW 45-MINUTE AUDIO? What was actually “misrepresented” here, Leslie?” – Project Veritas response 6:03 PM … Continue reading →
A special counsel was appointed to investigate President Trump without one shred of evidence he had done anything wrong. By contrast there is overwhelming evidence of corruption involving Joe Biden relating to Ukraine and China – and the press and … Continue reading →
There are three things that I am somewhat embarrassed of:
I am not a native Texan… I was born in Connecticut, but I got here as fast as I could.
I am a life-long New York Jets fan… I watch a recording of Super Bowl III every Super Bowl Sunday.
I am a life-long New York Mets fan.
One of my favorite books of all time is The Year the Mets Lost Last Place…
Date: 1969
After the Mets secured their World Series win in Game 5 on October 16, 1969, people wanted the story of that miraculous season as soon as possible. Paul Zimmerman and Dick Schaap would be the first among many to publish a comprehensive account, issuing their book on “the most amazing year in the history of baseball” only two days after the Mets won the World Series. How did they manage that? They documented the thrills of the season as they happened. By the time the Mets surprised the world with their upset of the Baltimore Orioles, Zimmerman and Schaap’s play-by-play prose was already in hand, ready for fans who wanted to learn about and relive one of baseball’s most inspiring triumphs.
I was ten years old throughout most of 1969. The Jets won Super Bowl III in January, Neil Armstrong took that “giant leap for mankind” in July and the Amazing Mets went from perennial last, or next-to-last, place finishers to upsetting the Baltimore Orioles four games to one in the World Series. 1969 will always be one of my favorite years… So I guess I shouldn’t rag on renewables for crawling out of last place… But, I will anyway.
APRIL 26, 2022 Renewable generation surpassed nuclear in the U.S. electric power sector in 2021
Electric power sector generation from renewable sources totaled 795 million megawatthours (MWh) in the United States during 2021, surpassing nuclear generation, which totaled 778 million MWh. The U.S. electric power sector does not include electricity generators in the industrial, commercial, or residential sectors, such as small-scale solar or wind or some combined-heat-and-power systems. Renewable generation includes electricity generated from wind, hydropower, solar, biomass, and geothermal sources.
Natural gas remained the most prevalent source of energy used in electricity generation in the United States, accounting for 1,474 million MWh in 2021. Although several U.S. coal-fired power plants retired in 2021, coal-fired electricity generation increased for the first time since 2014 and was the source of more U.S. electricity than either renewables or nuclear power. Total generation in the electric power sector increased slightly in 2021, but it remained less than its record-high year of 2018.
The increase in U.S. electric power sector renewable generation during 2021 came mainly from more wind and solar generation as a result of more wind turbines and utility-scale solar power plants coming online. Wind generation increased by 12% in 2021, and utility-scale solar generation increased by 28%. Hydroelectric generation decreased to its lowest level since 2015, mainly because of dry conditions in the western United States. Biomass and geothermal electricity generation remained relatively unchanged in 2021.
Renewables (wind + hydroelectricity + solar + biomass + geothermal) barely edged out nuclear power (795 to 778 million MWh) in 2021. This seems about as newsworthy as the New York Mets’ starting lineup hitting more homeruns in 1969 than Hank Aaron…
Hank Aaron hit his 44 homeruns in just 547 at bats. The Mets starting lineup required 3,250 at bats to rack up their 68 homeruns… giving us another analogy: MWh of generation per MW of installed capacity. The most recent EIA numbers are for 2020.
Nuclear power plants generated 778 million MWh from about 96,500 MW of installed capacity. Renewables required about 286,000 MW to rack up 795 million MWh. Nuclear power plants delivered a 92% capacity factor, renewables took 2/3 of the year off, only delivering a 32% capacity factor. The numbers aren’t exact because I’m using 2021 generation and 2020 installed capacity… But they are “in the ballpark.”