By Craig D. Idso — April 21, 2022
Dr. Craig Idso, Chairman of the Center for the Study of Carbon Dioxide and Global Change, invites readers to join him in a new series of articles discussing the many ways in which rising atmospheric carbon dioxide benefits humanity and nature. His introductory post is here.
“Based on the numerous experiments listed there, I can tell you that, typically, a 300-ppm increase in the air’s CO2 content … will raise the productivity of most herbaceous plants by about one-third, which stimulation is generally manifested by an increase in the number of branches and tillers, more and thicker leaves, more extensive root systems, and more flowers and fruit.”
Perhaps the most well-known and significant biological benefit of Earth’s rising atmospheric carbon dioxide (CO2) concentration is enhanced plant production.
Over the past five decades literally thousands of laboratory and field-based studies have been conducted to examine growth-related responses of plants at higher levels of atmospheric CO2. These CO2-enrichment studies, as they are called, are near unanimous in what they have found—increased levels of CO2 significantly enhance plant photosynthesis and stimulate growth.
This favorable outcome results from the fact that carbon dioxide is the primary raw material utilized by plants during the process of photosynthesis to build and construct their tissues. Think of it if you will as the “food” that sustains essentially all plants on the face of the Earth. And, fortunately, the more CO2 plants “eat” or take in from the air during photosynthesis, the bigger and better they tend to grow.
My company, the Center for the Study of Carbon Dioxide and Global Change, has been investigating the effects of atmospheric CO2 on plants for decades now. On our website we maintain a Plant Growth database, where we have archived the results of thousands of CO2 enrichment studies on hundreds of plants
Based on the numerous experiments listed there, I can tell you that, typically, a 300-ppm increase in the air’s CO2 content (note that the planet has already experienced approximately half of such increase since the Industrial Revolution began and will complete this full 300 ppm increase before the end of this century) will raise the productivity of most herbaceous plants by about one-third, which stimulation is generally manifested by an increase in the number of branches and tillers, more and thicker leaves, more extensive root systems, and more flowers and fruit.
Figure 1. Percent change in various growth and yield-related parameters of two pea cultivars in response to a 169 ppm increase in atmospheric CO2. Data presented in this graphic were derived from Table 1 and Table 2 of Kumari et al. (2019).
Figure 1 above illustrates such growth and yield-related benefits for two pea plant cultivars in response to a 169 ppm increase in the air’s CO2 content. Averaged for both plants, this relatively small rise in CO2 increased plant height by 13.9%, dry weight by 35.4%, number of pods per plant by 18.7%, pod length by 11.6%, pod girth by 16.5%, number of grains per pod by 28.4%, average pod weight by 41.5%, pod yield per plant by 33.7% and total pod yield by 33.7%. Such increases are remarkable considering that they were brought about solely by the scientists increasing the air with extra CO2.
The growth response of woody plants to atmospheric CO2 enrichment has also been extensively studied. Reviews of numerous individual woody plant experiments reveal a mean growth enhancement on the order of 50% for an approximate doubling of the air’s CO2 content (i.e., a 300 ppm rise).
Figure 2. Eldarica pine trees grown at the U.S. Water Conservation Laboratory in the mid-1980s by Dr. Sherwood Idso under ambient CO2 air and air enriched with an extra 150, 300 and 400 ppm of atmospheric CO2. Photo copyright and courtesy of the author.
Figure 2 illustrates this phenomenon for pine trees grown in normal air and air enriched with an extra 150, 300 and 450 ppm of CO2. Taken some 35 years ago, the person in the photo is my father, Dr. Sherwood Idso, who for many years worked at the U.S. Water Conservation Laboratory in Phoenix, Arizona, demonstrating the beneficial effects of atmospheric CO2 enrichment on plant growth, long before it became politically inconvenient to do so.
In one of his more famous experiments, my father grew sour orange trees in ambient and CO2-enriched air in the Phoenix desert for nearly two decades. In that study, which was the longest such experiment ever to be conducted anywhere in the world, trees exposed to a CO2 concentration 75% greater than normal annually produced 70% more biomass and 85% more fruit. And as icing on the cake, so to speak, the vitamin C concentration of the juice of the CO2-enriched oranges was between 5 and 15% greater than that of the juice of the oranges produced on the trees growing in ambient air.
Although much less studied than terrestrial plants, many aquatic plants are also known to be responsive to atmospheric CO2 enrichment, including unicellular phytoplankton and bottom-rooted macrophytes of both freshwater and saltwater species. Hence, there is probably no category of photosynthesizing plant that does not respond in a positive manner to atmospheric CO2 enrichment and that is not likely to be benefited by the ongoing rise in the air’s CO2 content.
So what do these growth-enhancing benefits of atmospheric CO2 enrichment portend for the biosphere?
One obvious consequence is greater crop productivity; and many researchers have acknowledged the yield-enhancing benefits of the historical and still-ongoing rise in the air’s CO2 content on past, present and future crop yields. In this regard, in my own studies of the subject I have calculated that the benefits of CO2 on agriculture are so important that without them, world food supply could well fall short of world food demand just a few short decades from now.
I have also calculated the direct monetary benefits of atmospheric CO2 enrichment on both historic and future global crop production. Over the past 50 years, that benefit amounts to well over $3 trillion. And projecting the monetary value of this positive externality forward in time reveals that it will bestow an additional $10 trillion on crop production over the next 50 years. Yet, as amazing as this estimate sounds, it may very well be vastly undervalued.
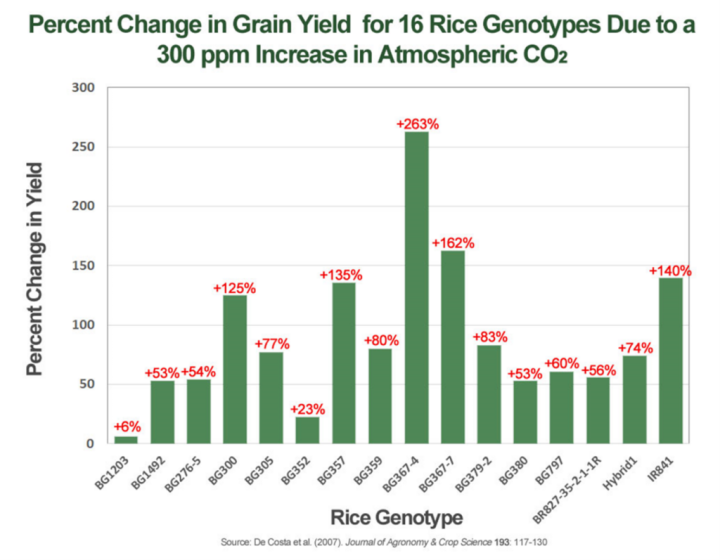
Figure 3. Percent change in grain yield for 16 different rice genotypes in response to a 300 ppm increase in atmospheric CO2. Source: Decosta et al. (2007).
Consider, for example, the fact that rice is the third most important global food crop, accounting for approximately 9% of global food production. Based upon data presented in my organization’s Plant Growth Database, the average growth response of rice to a 300-ppm increase in the air’s CO2 concentration is 33.3% (n = 428, standard error = 1.5%). However, as shown in Figure 3, a team of researchers who studied the growth responses of 16 different rice genotypes reported CO2-induced grain yield increases in those genotypes that ranged from near zero to a whopping +263%. Therefore, if countries learned to identify which genotypes provided the largest yield increases per unit of CO2 rise, and then grew those genotypes, the world could collectively produce enough food to easily supply the needs of all of its inhabitants, ending world hunger and staving off crippling food shortages that are projected to result in just a few short decades from now in consequence of the planet’s increasing human population.
Unfortunately, too many individuals and governments are locked into the false mindset that CO2 is a pollutant and so research has progressed but little on this front of late. Perhaps one day this will change when enough good people stand up and acknowledge as the father of modern plant CO2 research, Dr. Sylvan H. Wittwer, once stated, that “it should be considered good fortune that we are living in a world of gradually increasing levels of atmospheric CO2,” and that “the rising level of atmospheric CO2 is a universally free premium, gaining in magnitude with time, on which we can all reckon for the future.”
Only time will tell.
References
De Costa, W.A.J.M., Weerakoon, W.M.W., Chinthaka, K.G.R., Herath, H.M.L.K. and Abeywardena, R.M.I. 2007. Genotypic variation in the response of rice (Oryza sativa L.) to increased atmospheric carbon dioxide and its physiological basis. Journal of Agronomy & Crop Science 193: 117-130.
Kumari, M., Verma, S.C. and Bhardwaj, S.K. 2019. Effect of elevated CO2 and temperature on growth and yield contributing parameters of pea (Pisum sativum L.) crop. Journal of Agrometeorology21: 7-11.
via Watts Up With That?
April 23, 2022 at 04:12PM