Month: October 2022

Scientists Identify More Locations Where It Is Colder Today Than Anytime In The Last 10,000 Years

Sites in Canada and Africa were warmer than today throughout nearly the entirety of the Holocene.

Canada

Per a new study, eastern Canada mean summer temperatures are 13.6°C and July temperatures average 15°C today. For nearly all of the Holocene the region was 1-1.5°C warmer (16.5°C, July) than it is now.

In other words, except for a brief period during the Little Ice Age, the present temperatures are the coldest of the last 8000 years.

Image Source: Perrier et al., 2022

Scientists indicate that “in the last 150 yr, the reconstructed temperatures do not indicate a warming during this time” at sites in the Canadian Arctic (Fortin and Gajewski, 2016). Modern temperatures are 2-3°C colder than anytime in the last ~7000 years.

Image Source: Fortin and Gajewski, 2016

Scientists (Campbell-Heaton et al., 2021) studying another region in Arctic Canada also recently determined the ground surface winter temperatures now (1981-2016) average -33°C, whereas about 9000 to 10,000 years ago ground surface temperatures reached -18°C at this location, or 15°C warmer than present. Winter air temperatures, were, on average, “6-8°C warmer than today” at this time too.

Image Source: Campbell-Heaton et al., 2021

Africa

A new temperature reconstruction from Ethiopia indicates the region was 1-3°C warmer than it is today for nearly all of the last 10,000 years. In other words, it is colder now in Ethiopia than when CO2 ranged from 260 to 275 ppm.

Image Source: Bittner et al., 2022

According to a 2021 study published in PNAS, today’s temperatures in the Saharan region are the coldest of the last 13,500 years with the exception of a few centuries centered around 4,000 years ago.

And, correspondingly, the aridity in this region is worse today than anytime in the last 18,500 years, or since the peak of the last glacial – when CO2 was under 200 ppm.

Image Source: Cheddadi et al., 2021

via NoTricksZone

https://ift.tt/aVs9ZDA

October 31, 2022 at 11:35AM

UK start-up battery firm Britishvolt near collapse as it seeks funding


The UK’s supposedly marvellous ‘net zero’ electric future hits a bump in the road.
– – –
UK battery start-up Britishvolt could run out of money and go into administration after the government rejected a £30m advance in funding, reports BBC News.

The firm wants to build a factory in Blyth in Northumberland which would build batteries for electric vehicles.

The government, which had championed the development, had committed a total £100m to Britishvolt for the project.

It is understood the firm wanted to draw down nearly a third of the funding early but the government refused.

It has left the £3.8bn project, which has already been delayed several times, in doubt.

Britishvolt has struggled to find investors to help fund the construction of its so called gigafactory in Blyth which was expected to create 3,000 jobs.

It had been heralded by ministers as an example of “levelling up”, a Conservative aim of investing in communities to reduce economic imbalances with other parts of the country.

Blyth made election history in 2019 when it changed from Labour to the Conservatives.

The firm, which is yet to make any revenue, has in recent months held urgent talks to try to secure fresh funds to stay afloat.

A Britishvolt spokesperson said the company was “aware of market speculation” and was “actively working on several potential scenarios that offer the required stability”.

Full report here.

via Tallbloke’s Talkshop

https://ift.tt/17NM9zQ

October 31, 2022 at 10:48AM

ERCOT renewable energy: reality check

by Energy Meteorologist

A local example of the penetration problem for renewable energy in Texas

The Electric Reliability Council of Texas (ERCOT) operates Texas’ electric power grid that serves 25 million customers in Texas.  ERCOT’s sources of generating are natural gas (51%), wind (24.8%), coal (13.4%), nuclear (4.9%), solar (3.8%), and hydroelectric or biomass-fired units (1.9%).  Power demand in the ERCOT region is typically highest in summer, primarily due to air conditioning use in homes and businesses. ERCOT region’s all-time record peak hour occurred on July 8, 2022, when consumer demand hit 78,204 MW.

This article describes an extended lull in wind and solar power during the period 8/1/22 – 9/12/22.  I then describe what it would take in terms of a system with 100% renewable generation plus storage to produce sufficient electric power for Texas during such a lull.

For background, read these previous articles by Planning Engineer:

Assigning blame for blackouts in Texas

The Penetration Problem. Part I:  Wind and Solar – The More You Do, The Harder it Gets

The Penetration Problem. Part II: Will the Inflation Reduction Act Cause a Blackout?

August 2022 temperatures for Texas were fairly typical – hot (daily high temperatures frequently broke 100oF), but not exceptional.  Texas temperatures during the first two weeks of September were slightly cooler than normal, with daily maximums in the high 80’s as a wet pattern enveloped most of the state.  What was exceptional about this period was an extended lull in both wind and solar power in the ERCOT region.

This chart plots the actual electricity demand (load) for ERCOT during the period 8/1/22 – 9/12/22 vs combined wind and solar production of electricity.  During this period of lull in renewable energy production, the demand loads were pushing into the mid and upper 70 GW range.

Screen Shot 2022-10-30 at 9.25.15 AM

What would it take for a hypothetical electric power system to meet such a demand solely with wind and solar power?

Texas saw wind generation fall to 600 MW or lower with demand loads of 41-43 GW in the early AM hours when solar was zero, so it’s either 75 times wind capacity or a crapton of batteries. Either way, massive amounts of battery storage are needed in ERCOT for a 100% wind/solar/hydro grid. 400 – 450MWh of batteries would be needed to cover the extended wind lulls around Aug 22nd and Aug 30th, and during both events the batteries would be drained to 5-15% of capacity. Come the next day, you need excess energy to charge them so they can be used again the following night. The deepest discharge period (Aug 30th – Sep 2nd) during this time lasted for 63 hours and required a discharge of ~940 MWh while only charging ~75 MWh over that time period.

Clearly, a massive buildout of wind and solar would be needed to cover that gap.  Two scenarios are considered here, using back-of-the-envelope calculations.  Scenario #1: if you increase wind and solar 8 times current capacity AND add 900 GWh of battery storage, you would have been able to cover that month-long period with 100% renewables; this turns out to be much more cost efficient than the second scenario.  Scenario #2: wind at 4.05 times current capacity and solar at 8.45 times current capacity with 5000 GWh of battery storage.

Screen Shot 2022-10-30 at 9.42.50 AM

Yes this whole scenario is rather sketchy, but how much would it actually cost?  For Scenario #1, 8X the current wind buildout and 8X the current solar buildout (364,000 MW) plus 900,000 MWh of battery storage, the cost would be $800 billion + transmission.  This calculation assumes that the charge/discharge of the batteries is 100%; if you take into account losses, you need another 10-15% of battery storage.  Additional transmission lines cost $2 to $5 million per mile.  Scenario #2 is much more expensive than Scenario #1.

The scenario costs are  based on the following cost assumptions (see References at end of post):

  • Cost of Wind $1.35 Million /MW
  • Cost of Solar $1.5 Million/MW
  • Battery cost $385,000/MWh

Compare this with an estimated cost of nuclear power at $9 million /MWh, whereby that same amount of money for renewables ($800 billion) could build over 90 GW of nuclear power vs the 230,000 MW of renewables.   The figure below shows the current renewable generation stack plus the buildout of nuclear power (red line). Using that money to build out nuclear power instead would yield more power than ERCOT would need for the coming few years even with steady load growth AND would use <1% of the land area of the renewables. If you site the nuclear power plants at old coal facilities and outdated gas plants, the transmission interconnection is already there and costs would decrease as more nuclear capacity is built.

Screen Shot 2022-10-30 at 9.52.14 AM

The recent month long period was unusually light for wind and solar BUT that is what electricity grids need to be designed for.  Assuming the 8xWind and 8xXolar + 900,000 MWH of batteries, this is what the summer would have looked like from a supply standpoint with batteries fully charged.  A little overkill, IMO.  Remember this assumes the charge and discharge of the batteries is 100% efficient, if you use a more realistic estimate you need to increase the battery storage by 10-15%

Screen Shot 2022-10-30 at 10.00.30 AM

Power production from wind and solar hardware typically decays at 0.5% per year. Not much at first, but half way through their lifecycle it adds up to BIG numbers. Load growth as well needs to be taken into account, with 82 GW possible in the coming summer for peak demand. ERCOT has been averaging ~2 – 3% growth per year.

Since ERCOT is more or less an isolated grid, it is a good example for an academic/economic exercise such as this.  With such an overbuild of wind and solar for ERCOT, there would be a great deal of curtailed/wasted power once the batteries were fully charged. This chart shows the hypothetical wasted power for the recent Aug/Sept period with the 8xWind, 8xSolar and 900,000MWh batteries.  The grid would have wasted/lost a total of 37.54 TWh to serve a total load of 63.17 TWh. If you want to transport that power elsewhere, remember it costs $2 to $5 million per mile for new transmission lines.

Screen Shot 2022-10-30 at 10.02.02 AM

Wind and solar are cheaper to build, but not when you take into account the overbuild and storage to fully serve the grid.  When total costs are considered, nuclear power is the cheapest option while also having the smallest environmental footprint overall.

Here is a link [ERCOT Load vs Renewables ] to the spreadsheet, you can play around yourself with different scenarios.

References 

https://www.eia.gov/todayinenergy/detail.php?id=45136

https://www.nrel.gov/docs/fy21osti/79236.pdfhttps://news.mit.edu/2020/reasons-nuclear-overruns-1118

https://constructionphysics.substack.com/p/why-are-nuclear-power-constructionhttps://www.bloomberg.com/graphics/2021-energy-land-use-economy/?leadSource=uverify%20wall

Click to access 20190212%20PSC%20Item%2005a%20Transmission%20Cost%20Estimation%20Guide%20for%20MTEP%202019_for%20review317692.pdf

xhttps://https://ift.tt/dOxP7RV

https://www.caiso.com/Documents/PGE2018FinalPerUnitCostGuide.xlsxhttps://www.bakerinstitute.org/research/texas-crez-lines-how-stakeholders-shape-major-energy-infrastructure-projects

x

via Climate Etc.

https://ift.tt/ds2q6yF

October 31, 2022 at 09:53AM

2022 Hurricane Season Winding Down

The Atlantic hurricane season runs from June 1 through Nov. 30.  The official peak of the season was Sept. 10; Hurricane Ian made landfall on September 27. The season ends November 30 and in the past 172 years, only 13 tropical storms and 7 hurricane landfalls have occurred in the continental U.S. on or after October 27.

2022 Accumulated Cyclone Energy [ACE], updated October 31, 2022 by Dr. Ryan Maue *Yearly climatology from historical 1991-2020 Tropical cyclone best track datasets  Source: Global Tropical Cyclone Activity 

The chart shows NH is below a normal YTD, the difference being an unusually quiet Western Pacific.  Elsewhere, the activity is around 90% YTD.

The North Atlantic 2022 year to date (YTD) update by Dr. Maue includes 13 storms, three in October.

Alex 01L (60, ACE= 2.8325, June)
Bonnie 02L (50, ACE= 2.6525, June)
Colin 03L (35, ACE= 0.49, July)
PTC Four 04L (30, ACE= 0.0, July)
Danielle 05L (80, ACE= 12.545, Sep)
Earl 06L (90, ACE= 14.2225, Sep)
Fiona 07L (115, ACE= 26.2825, Sep)
Gaston 08L (55, ACE= 5.205, Sep)
Hermine 10L (35, ACE= 0.6125, Sep)
Ian 09L (135, ACE= 17.425, Sep)
TD 12L (30, ACE= 0.0, Oct)
Julia 13L (75, ACE= 2.87, Oct)
Karl 14L (50, ACE= 2.12, Oct)

Fiona and Ian were the two major hurricanes over 100 knots with the highest ACE, followed by Earl and Danielle. Julia was the fifth hurricane, > 64 knots. Ten storms were 5 ACE or less.

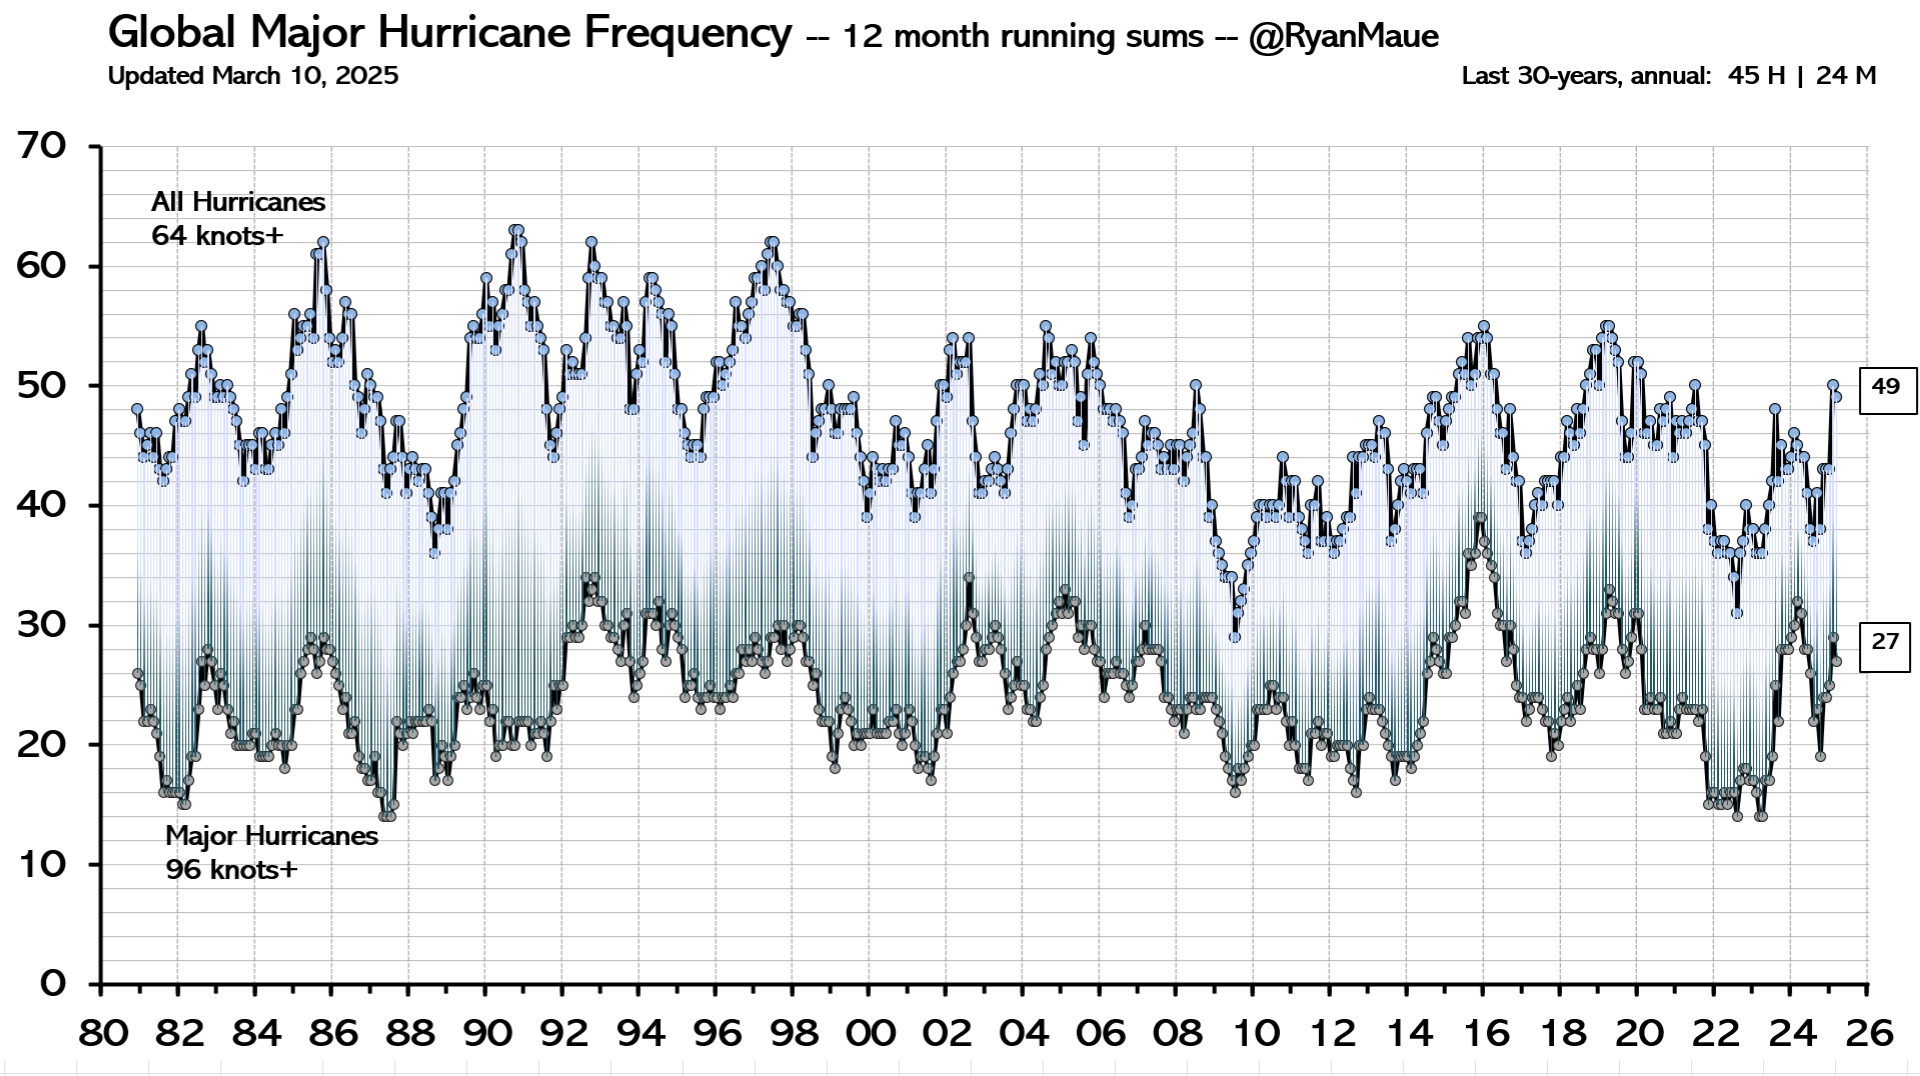
Figure: Global Hurricane Frequency (all & major) — 12-month running sums. The top time series is the number of global tropical cyclones that reached at least hurricane-force (maximum lifetime wind speed exceeds 64-knots). The bottom time series is the number of global tropical cyclones that reached major hurricane strength (96-knots+). Adapted from Maue (2011) GRL.

Background Post How Terrifying will be 2022 Hurricanes?

Jeffrey Folks wrote August 25, 2022, at American Thinker How Terrified Should We Be of Hurricane Season This Year?.  Excerpts in italics with my bolds and added images.

Once again, as nearly every year, officials at NOAA and other agencies called for 2022 to be a “very active” hurricane season. In its May 24 release, NOAA predicted “an “above-average hurricane activity this year — which would make it the seventh consecutive above-average hurricane season.” It’s like the old joke that everyone’s grandkid is “above average”: for some reason, every hurricane season, the risk is now “above average.”

I don’t know how every year can be “above average,” something that defies the laws of statistics. I suspect that it has to do with the strong bias of climate scientists rather than the strength of hurricanes. And in fact, hurricanes have been “fewer than average” this year and for many years recently.

So far, halfway through the hurricane season, no Atlantic storms have made landfall on U.S. soil.

This lack of severe storms defies the dire predictions of global warming alarmists: that rising temperatures will cause catastrophic storms. In reality, one reason why there are fewer and less severe storms this year is that the Atlantic waters have been cooler than usual. That, combined with drier air over the Atlantic, caused by the atmospheric drift of Saharan dust, has caused potential tropical storms to dissipate.

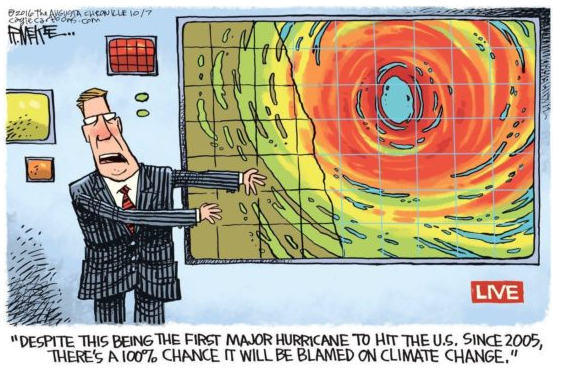
Predictions of “very active” storm seasons are widely publicized each spring, but the reality of fewer and less severe storms never makes its way into the media.

The truth is that some hurricane seasons are more active and some less so. The same is true of tornadoes, droughts, floods, and other natural phenomena. But only the extreme events get publicized and treated as confirmation of climate change. If the media were honest, they would report the truth that the weather has not changed a great deal, at least not since the end of the Little Ice Age in 1850 — and the warmer temperatures since then have been a blessing.

Global temperatures have risen one degree Celsius since the low point of 1850, so severe storms may be somewhat more common than in the distant past. But death rates have dropped precipitously. The worst hurricane in American history was the Great Galveston hurricane of September 8, 1900, which killed some 8,000 people. The worst tornado recorded in U.S. history was the Tri-State Tornado of March 18, 1925, which killed 751 people. Both of these storms occurred long before the period in which alarmists like Al Gore predicted that global warming would cause catastrophic storms — and clearly, they were not “man-made.”

We are safer now because of technology. With advance warning, populations can take shelter or evacuate, and a smartphone or weather radio is all that is necessary to receive warnings. As warning systems become more sophisticated, fewer people will die or be injured by severe weather events. But the development of those systems depends on the ability of individuals to pay for them, and recent government spending will make that less likely — just as it will affect medical research, transportation safety, and police protection.

In addition to the “regular” budget of $5 trillion, this year, Biden has appropriated $7 trillion in emergency spending, much of it for climate change. But that money is not intended to protect us from severe storms. It is being spent on green energy boondoggles that enrich connected insiders but impoverish average citizens. And that impoverishment is the heart of the problem.

With less wealth, it is more difficult to protect oneself against severe weather. Even in years like 2022, which have so far been less active than normal, homeowners must be vigilant if they live along the Atlantic Coast, especially in Florida and other hurricane-prone states. Three months of the hurricane season remain. The odds are that an Atlantic hurricane will strike the East Coast. If a hurricane does make landfall, the media will tout it as proof of the catastrophic effects of global warming. In reality, it will just prove that the climate hasn’t changed much.

Since the destructive 2004 hurricane season, Florida has required all new construction to incorporate tie-down roofing and storm-resistant glass, measures that have made life safer for residents. And since taking office, Gov. Ron DeSantis has maintained storm preparedness and worked to protect citizens of Florida.

But Biden’s ludicrously entitled “Inflation Reduction Act” does nothing to strengthen homes and businesses. Its primary aim is to reward Democrat donors, including unions and green energy corporations. How does the mandate of a “union wage” included in the bill help protect Americans against severe storms?

But prosperity really is the solution to global warming. There may or may not be more severe storms this year or the next. Human beings have no control over that. But they can control how well prepared they are for the events — that is, if government leaves them with enough money to do so.

See also Hurricanes Unrelated to CO2

Integrated Storm Activity Annually over the Continental U.S. (ISAAC)

via Science Matters

https://ift.tt/n5TePjV

October 31, 2022 at 09:01AM