
By Paul Homewood
As we know, last month was much milder than average. In England it ranked 4th warmest, though well below the warmest in 1994.
However averages only tell part of the story. While the Met Office have linked it to global warming, the daily data shows a much subtler story:

https://www.metoffice.gov.uk/hadobs/hadcet/data/download.html
Daily mean temperatures did not rise above the ceilings set in the majority of the past 30 years. Instead the monthly average was higher than normal because of the almost complete absence of colder than average days, particularly extremely cold ones.
This pattern is also exhibited in the three Novembers which were warmer – 1994, 2011 and 2015.
This is strong evidence that we are seeing is weather, and not climate change. If it was the latter, we would see the whole range shifting upwards. (Picture, if you will, a chart comparing temperatures in London and Newcastle).
And we see exactly the same with daily temperatures throughout this year. Apart from a few days, daily temperatures have stayed within the upper half of the “normal” band:
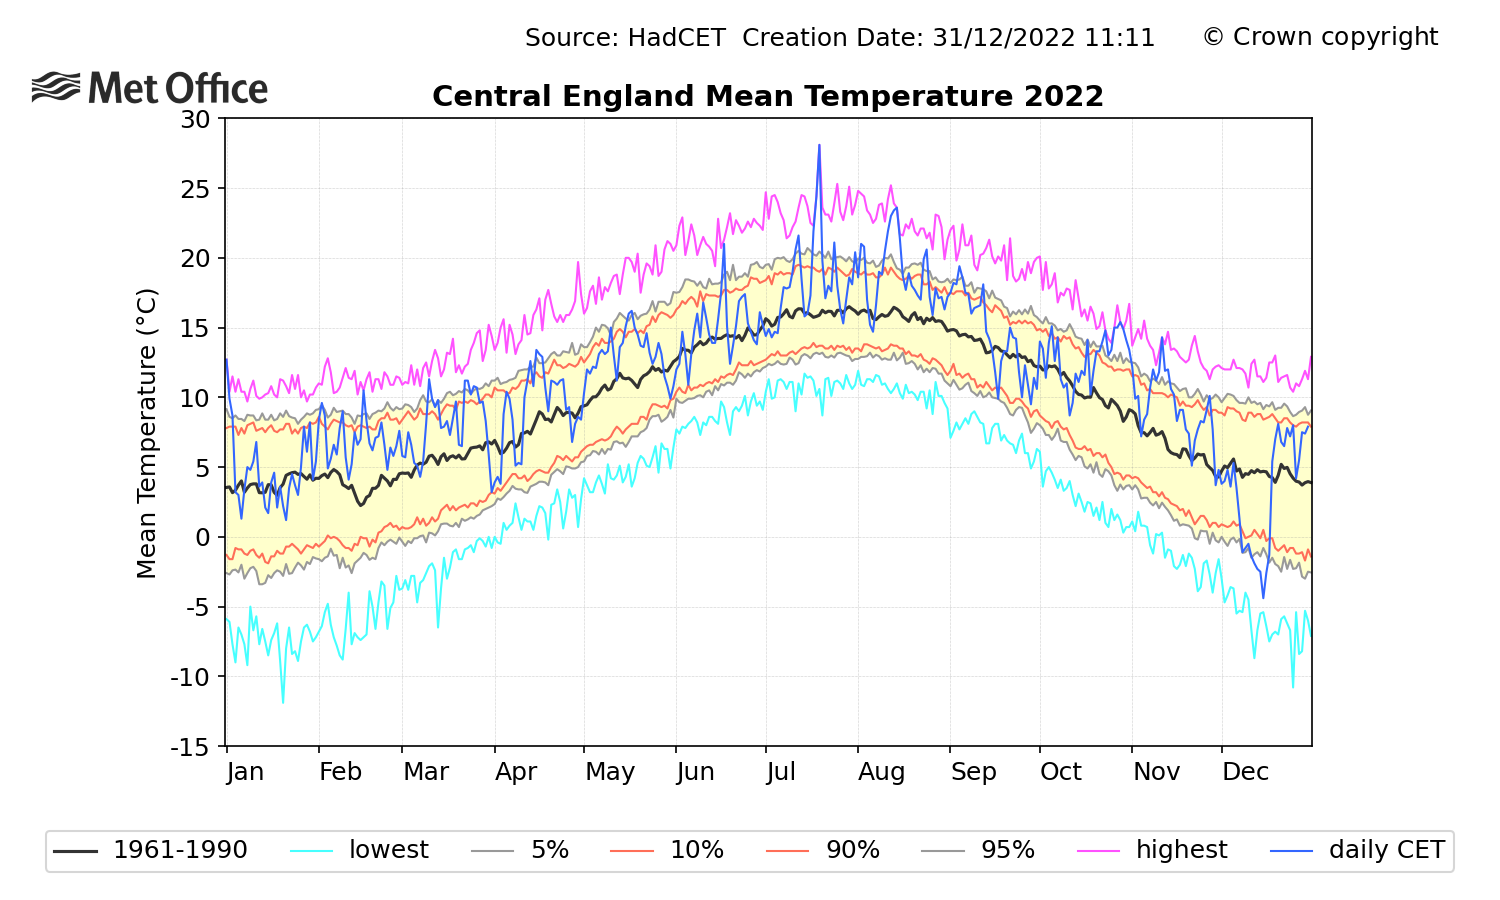
British weather is extremely variable because of its geographic location. We can get dry and wet weather, and hot and cold weather, all dependent upon which direction the weather is coming from, and whether it is cyclonic or anti-cyclonic.
This year, for whatever reason, the warmer side of the weather spectrum has prevailed.
https://www.metoffice.gov.uk/hadobs/hadcet/graphs/2022/daily_meantemp_cet_2022.png
via NOT A LOT OF PEOPLE KNOW THAT
December 5, 2022 at 12:26PM
