Month: January 2023

Total Frauds: Routine Collapses Mean Wind & Solar Deliver Net Zero Power On Daily Basis

Calm weather and sunset will do it every time, smashing wind and solar output and claims that we’re already headed for an all wind and sun powered future.

Believe the narrative run by the MSM on behalf of the wind and solar rent seekers and their political enablers, you’d think we’ve already reached our ‘green’ energy nirvana. But, even if there is some kind of concession made to wind and solar’s hopeless intermittency, the promise is that we’ll hit our wind and solar-powered Utopia, just as soon as we’ve added a few trillion dollars’ worth of giant Teslas to the grid.

The grand transition narrative relies upon general ignorance about the difference between averages and absolutes.

Averaging wind and solar output over annual timeframes might make them look like true energy heroes, but ignores the fact that power consumption is a here-and-now kind of thing.

Crowing about a few minutes when demand is met by wind and solar, alone, is not just cherry-picking, it is downright dishonest.

Take South Australia, Australia’s wind and solar capital. SA suffers Australia’s highest power prices and, quite naturally, Australia’s highest rate of unemployment. It is also renowned as an economic backwater, best described as an old folks home for poor people.

South Australia became the butt of international jokes on account of the numerous uncontrolled blackouts it has suffered, including the big one in September 2016 when the whole State went black: SA’s Wind Farms Guilty: 28 September ‘Black System’ Caused by Wind Power Output Collapse; parts of it for more than a week: South Australia’s September Wind Power Blackout Cost Businesses & Households $367 Million

These days, it relies heavily on coal-fired power imported from Victoria and NSW, as well as diesel-fuelled ship engines and diesel-fuelled open-cycle gas turbines – built after its run of monster blackouts – to keep the grid up and running, whenever the sun sets and/or calm weather sets in.

Wind power routinely collapses in SA (just like everywhere else). Occasions like 13 January 2023 (see above), when SA’s 2,351 MW of wind power capacity hit the floor, bottoming out at a risible 44 MW (1.87% of total capacity).

These are the days that you’ll never hear about from the wind cult and the shills in the MSM that run their infantile narrative.

On the other hand, Rafe Champion is determined to make sure you know as much about their hopeless failures as their brief and monetary ‘successes’.

SA windpower fails, as usual
New Catallaxy
Rafe Champion
18 January 2023

It is time for the politicians, planners and commentator to face the fact that wind and solar power have failed in South Australia. This is the wind leader, the trail-blazing pioneer of the new age of “clean” power.

It has become the canary in the coal mine, the red flag, a warning to all who would follow the path to become a “renewable energy superpower.”

The illusion of success is achieved by selective reporting.

Practically every week new heights of wind and solar penetration are achieved and this is greeted with wild applause. The same thing is happening in Britain where they have just announced record penetration of wind power in 2022.

People have to realise that the green transition is not being dragged up to follow higher levels of penetration, it is constrained by the lowest level which is zero on windless nights. The convoy moves at the speed of the slowest vessel, the water breaches the levy at the low point, a chain is only as strong as its weakest link, the weasels get out of the yard through gaps in the fence even if you build the rest of the fence to the sky.

Forget about solving the problem by installing more wind and solar. And forget about storage, there is effectively none at grid-scale now and none is in sight in the foreseeable future. So-called big batteries are installed to make money out of gaming the system that has been destabilized by injecting intermittent, unreliable, weather-dependent energy. The intermittent energy system is also ruinously expensive and filthy dirty. Fossil power using modern scrubbing technology to eliminate nitrates, sulphides and particulate matter is pristine by comparison.

The conflicting stories describe “a game in two halves” as football commentators say. In the other half of the story in SA almost every day there are periods when they are importing coal power from Victoria or burning gas, and often both. They frequently have recourse to diesel generators, as they did this morning at least up to 10am Sydney time because the wind in SA is only average (CF 30%.)

In Britain and Germany domestic power prices are going through the roof, power-intensive industries are closing down and new coal mines are being opened up.

Has the world gone crazy?

No, just the energy planners, driven by terror of “the breath life”, CO2.

Think about this! Look at the situation in Britain.

Then ask yourself whether you would invite one of the architects of that power system to come and lead our Energy Market Operator? No?

Meet Daniel Westerman who replaced Audrey Zibelman to become our “energy czar” at the helm of AEMO, the Australian Energy Market Operator:

Mr Westerman managed the electricity network across England and Wales and has led transformation and change programs across multiple business units and geographies.

His significant commercial and regulatory experience in both the UK and the US mean he is well-positioned to lead a key institution like AEMO through this period of significant change in the energy market.

Famous last words?

More details on the British debacle

London, 17 January 2023 – After the much-lauded battery start-up Britishvolt collapsed into administration, Net Zero Watch has reiterated its warning that the Government’s policy of green interventionism and Net Zero dogmatism is a recipe for economic and political disaster.

Described as a ‘gigafactory’, the collapsed EV battery factory was meant to be a symbol of levelling-up and would show how a green “planned economy” could herald an industrial renaissance.

UK Government ministers had committed £100 million to the battery project, apparently without a sound business plan, because it aligned with official rhetoric on Net Zero.

The company blamed Britain’s “ballooning energy costs” for its predicament, and its ultimate collapse.

In recent months, BMW has announced it is moving manufacturing of the electric Mini from the UK to China, where manufacturing is powered by cheap coal. Other carmakers plan to slash the number of electric vehicles they manufacture because rising prices and the spiralling cost of electricity makes them increasingly unaffordable for drivers.

Dr Benny Peiser, Net Zero Watch’s director, said:

“This fiasco was utterly foreseeable and was indeed foreseen by us and other analysts — but not by complacent ministers and incompetent civil servants. BMW’s China exodus and Britishvolt’s collapse won’t be the last casualties of the government’s green command and control economy.”

Throwing money at projects without a sound business plan because they align with official rhetoric on Net Zero is a new pandemic, happening in Australia in the private (Sun Cable) and public sectors (hydrogen hubs) and in the US at a much grander scale under the aegis of the Legislation to Increase Inflation and Debt which has the Orwellian label Inflation Reduction (black is white and white is black.)

Meawhile coal surges in Europe and most other places

And Voices intervene to ensure that there is no more gas coming on stream in New South Wales to avert the collapse of the power supply when coal stations go out of business.
New Catallaxy

via STOP THESE THINGS

https://ift.tt/JQ2dchY

January 30, 2023 at 12:34AM

Monday Open Thread

Monday Open Thread

0 out of 10 based on 0 rating

via JoNova

https://ift.tt/9RWtkjp

January 29, 2023 at 09:37PM

The Climate Alarmist’s Greatest Fear

By Andy May

Is it just me, or are the climate alarmists more unhinged than usual lately? Al Gore screaming about boiling oceans and rain bombs is just part of it. As Eric Worral has reported, the BBC blamed global warming for the lack of snow, just after they blamed global warming for colder winters. And, who can forget John Kerry’s World War II style mobilization to fight a possible man-made climate change disaster? What disaster? There is no observational evidence today that human activities are causing any climate-related problems and there is considerable evidence that warming and additional CO2 have been beneficial since the so-called “pre-industrial.”

Could they be worried that global warming is slowing down? Are we entering another hiatus or pause in warming (horrors!)? Talk about in-your-face humiliation. They didn’t predict the first “Pause” from 1998-2014, if they miss another one, how does that look? Certainly, CO2 is marching on at a steady pace, as shown in Figure 1. No slowdown there.

Figure 1. Plot of yearly average Mauna Loa CO2 data from NOAA, and a second-order polynomial projection to 2032.

If the atmospheric CO2 concentration continues to increase as it has in recent years, it will be 438 ppm in 2032, what if there is no warming, or very little warming, between now and then? How does that look?

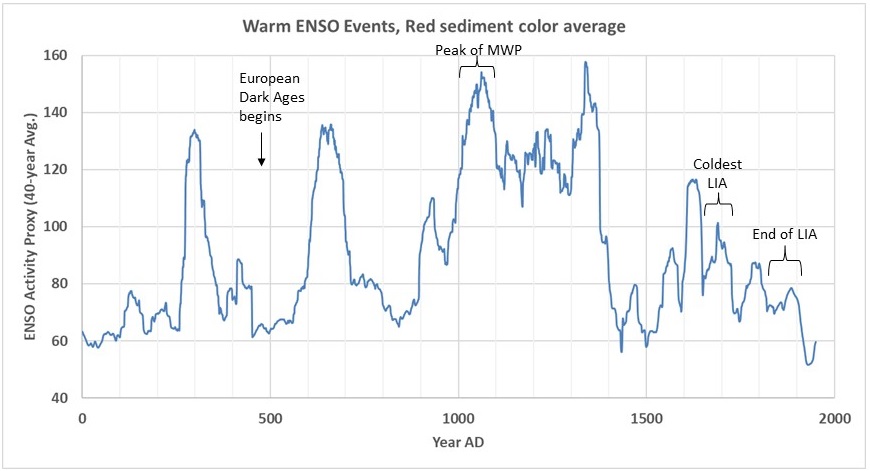
We will remember that the first pause occurred after the 1998 super El Niño. The 1998 Niño marked the beginning of a major climate shift that resulted in the Pause in global warming. This is logical, El Niño’s are nature’s way of expelling excess heat from the ocean to the atmosphere so it can be radiated to space. El Niños temporarily warm Earth’s surface but have a long-term cooling effect. The frequency of El Niño events was greatly reduced during the Holocene Climatic Optimum (Moy, Seltzer, & Rodbell, 2002), which ended about 6,500 years ago when the long Neoglacial cooling period began. According to Christopher Moy’s El Niño proxy data, we see that as the world entered the Little Ice Age, the nadir of the Neoglacial Period, the frequency of El Niño’s peaked, then declined as the world got colder. El Niños became very rare in the early 20th century when Moy’s record ends, as shown in Figure 2.

Figure 2. The 40-year average of warm ENSO proxy events from Christopher Moy’s data. Only the stronger El Niños are captured. El Niños cause immediate warming, but longer term they result in cooling since they expel ocean heat to the atmosphere and the atmosphere eventually expels the heat to space. El Niño frequency peaks in warmer times and cooling follows. Data source: (Moy, Seltzer, & Rodbell, 2002), analysis by Javier Vinós, plot by the author.

Moy created the dataset plotted in Figure 2 from a sediment core taken in southern Ecuador. See the location map in Figure 3. Red sediment color intensity in this core correlates well to warm ENSO events in modern times since positive precipitation events in Ecuador are strongly related to warm ENSO (El Niño) events. The lighter colored inorganic reddish clastic layers contrast strongly with the very dark colored organic-rich siltier layers from the lower-precipitation ENSO cooler periods. Moy’s examination of the area indicates that his cores only capture moderate to strong El Niño events, weak events may not create the colors he associates with El Niños.

Figure 3. Location of Moy’s core, near Laguna Pallcacocha high in the Andes in southern Ecuador, not be confused with the much larger Laguna Palcacocha in Peru. From Google Earth.

Given this data and history, it is quite possible that the large 2015-2016 El Niño might result in another long-term cooling effect. After all, since the El Niño, we’ve had three La Niñas, which collect and store ocean heat. How are we doing so far? See Figure 4.

Figure 4. The UAH satellite global lower troposphere temperature record from yearly averages. Source: UAH.

After the 1997-1998 Niño we had rapid atmospheric warming as heat was transferred from the ocean to the atmosphere. Then, through meridional transport the heat was moved from the tropics to the higher latitudes and altitudes and expelled to space. This caused the world to cool for a period. Then we had another large El Niño in 2015-2016 and the atmosphere warmed again, only to settle into a new cooling phase. Over the whole record, the secular, or long-term, warming trend is 0.0133°C/year. Figure 4 is constructed using yearly average lower troposphere satellite temperatures.

Figure 2 shows that frequent strong El Niños occurred as the world entered the Little Ice Age, they signal eventual global cooling. El Niños became quite rare as the Little Ice Age ended. We’ve had two very strong El Niños only 18 years apart, are they a sign of cooling ahead?

What else do we see today? As shown in Figure 5, we have exited the Modern Solar Maximum, global temperatures appear to have peaked and are falling, and the Atlantic Multidecadal Oscillation (AMO) has plateaued and appears to be about to decline. The previous decline (~1957 to ~1977) in the AMO coincided with the unusual cooling period from ~1947 to ~1977.

Figure 5. The top graph shows the SILSO sunspots smoothed and that we have exited the Modern Solar Maximum. The middle graph shows the HadCRUT 4 global surface temperature smoothed. The bottom graph is a smoothed record of the Atlantic Multidecadal Oscillation (AMO).The colors indicate qualitative meridional transport intensity. Source: The Winter Gatekeeper, part VII.

Figure 5 illustrates the correlation between solar activity, North Atlantic Ocean sea-surface temperature and global average surface temperature. This apparent correlation is ignored by the IPCC, who prefer their climate model calculation of the human contribution to climate change, which is very poorly supported in observational data.

What happens if we project the trends in Figure 5 into the future? See Figures 6 and 7.

Figure 6. The Bray (2475-year), Centennial or Feynman (105-year), deVries (210-year), and Eddy (980-year) cycles are projected into the future. Source (Vinós, 2022, p. 133). Currently we are in a Feynman low.
Figure 7. Clilverd low-frequency modulation solar model shown in black and actual sunpots shown using red and red-dashed lines. Source (Vinós, 2022, p. 130). The Dalton, Gleissberg and Clilverd solar minima are noted. The current Clilverd minimum should end during the 2030s and warming will then resume as we head into a new solar maximum. Data: (Clilverd, Clarke, Ulich, Rishbeth, & Jarvis, 2006).

Discussion

The AMO is a leading indicator of the climate state since it is a measure of sea surface temperature in the North Atlantic Ocean, a principal avenue of meridional transport of heat from the tropics to the North Polar region. It tends to warm and cool periodically. When it warms, meridional transport is weak, and the polar vortex is strong. This traps cooler air in the Arctic and keeps the rest of the planet warm. When meridional transport strengthens and the polar vortex weakens, more heat is transported to the Arctic, more cold Arctic air escapes to the middle latitudes, and the AMO index becomes more negative due to a cooling North Atlantic.

Changes in solar activity very roughly track changes in the AMO, but the correlation is poor due to the strong effect that the Sun has on the stratosphere. The stratosphere and ENSO affect both polar vortex strength and meridional transport.

Solar activity probably ultimately drives long-term climate change, but in the shorter term, the solar effect is obscured by changes in the meridional transport of energy, which has a lot of drivers. It is the strength of this meridional transport that directly causes global climate changes and the energy it transports provides the energy to change the climate. Variations in solar activity only trigger the changes. Other important factors in natural climate change are climate system inertia, internal ocean variability, and changes in stratospheric ozone and winds. In the very long term, changes in Earth’s orbit play a role.

So, a warning to Al Gore, John Kerry, and the BBC. You need to realize that your now 50-year-old very out-of-date hypothesis that humans dominate climate change through fossil fuel emissions and other human activities is becoming less likely with time. It has not escaped our notice that the IPCC has published 47 reports on the possible dangers of man-made climate change over the past 32 years, and yet polls suggest the public is not convinced climate change is a priority. The next ten years will test your climate change ideas, and the result may not be pretty.

Works Cited

Clilverd, M. A., Clarke, E., Ulich, T., Rishbeth, H., & Jarvis, M. J. (2006). Predicting Solar Cycle 24 and beyond. Space Weather, 4. doi:10.1029/2005SW000207

Moy, C., Seltzer, G., & Rodbell, D. (2002). Variability of El Niño/Southern Oscillation activity at millennial timescales during the Holocene epoch. Nature, 420, 162-165. Retrieved from https://ift.tt/7AXS0jv

Vinós, J. (2022). Climate of the Past, Present and Future, A Scientific Debate, 2nd Edition. Madrid: Critical Science Press. Retrieved from https://ift.tt/mIQcUg3

via Watts Up With That?

https://ift.tt/jRX65SV

January 29, 2023 at 08:30PM

2050: The never-ending nightmare of Net Zero 


Classifying this as humour may not be appropriate, but we live in hope.
– – –
IT IS the year 2050 and Britain, relentlessly driven by the governing Labour-Green coalition, has achieved Net Zero, imagines David Wright @ TCW (The Conservative Woman).

The nation is quite unrecognisable from the comfortable, well-fed country it was in the early part of the 21st century.

Massive wind turbines cover the landscape; the old ones built 25 years ago now knocked down and lying next to the new ones because it was uneconomic to remove them.

The whole country is covered in a dense spider’s web of power lines from the multitude of wind and solar farms miles from where the power is needed.

Offshore wind farms died ten years ago: it became impossible to maintain them because all the workboats were rusting in port with no fuel. Thousands of acres of formerly productive agricultural land are now solar farms with nothing but weeds growing beneath the panels.

Other forms of so-called zero carbon energy production failed to take off or were abandoned years ago. Drax power station’s last two biofuel units (which produced more CO2 than the coal-fired units, but were laughably classed as carbon neutral by the eco-zealots on the grounds that new trees would grow to replace the wood pellet fuel) were shut down when the United States government, led by President Alexandria Ocasio-Cortez, stopped cargo ships from using fossil fuels.

Hinkley Point C and Sizewell C nuclear power stations came onstream just in time as the last of Britain’s previous generation nuclear plants reached the end of their lives. Small modular reactors (SMRs) pioneered by Rolls-Royce and GE Hitachi were subject to endless bickering over cost in Parliament and only six were built.

Green hydrogen was long considered the answer to fuelling transport but a pilot project in Hull consumed so much renewable electricity to make such a small quantity that diverting the power from households and what was left of businesses could not be justified. This, coupled with the astronomical cost of compressing it, storing it, fitting high pressure tanks to vehicles and changing natural gas pipelines because hydrogen was more corrosive, resulted in the trial being ended after 18 months.

Eight giant so-called grid scale battery farms were built in the previous 20 years. They were effective at stabilising the grid but when used to supply power during winter wind droughts went flat after a few minutes and then took weeks to trickle charge using the small amount of power that could be spared from users.

So the nation is suffering strict rationing of small amounts of intermittent electricity from renewables. The £200billion HS2 white elephant stopped operating two years after its 2039 inauguration (ten years behind schedule) when not enough electricity was available to run it. The operator tried a two-carriage version run by solar panels on its roofs but it slowed to a crawl when clouds came over or it went into a tunnel.

Cars, for those who can afford them, can undertake only short journeys because although plenty of charging points are available and all the different connections were eventually standardised there is insufficient spare electricity at most times when people need to charge.

Full article here.

via Tallbloke’s Talkshop

https://ift.tt/USsApNG

January 29, 2023 at 04:44PM