The most important story in the hockey world, according to sports media, is that one player decided not to wear a gay pride jersey, and they are deeply upset about it.
Philadelphia Flyers defenseman Ivan Provorov did not take part in the team’s warm-up for “LGBTQ+ Pride Night,” with the rest of the team wearing pride-themed warm-up jerseys and wrapping rainbow tape around their hockey sticks. Provorov opted not to participate “to stay true to myself and my religion.”
This means he should have been benched, if not outright fired, according to sports media.
One reporter asked coach John Tortorella after the game if he considered benching Provorov for not wearing the jersey. Steph Driver, the NHL editorial manager for SB Nation, was outraged that he was “allowed” to play. Sports Illustrated’s Mike Stephens called his actions “disgusting” and said he should have been benched. The Athletic’s Pierre LeBrun accused him of “hiding behind religion” and said Provorov didn’t respect everyone. ESPN’s Greg Wyshynski accused everyone defending Provorov of being “homophobes.”
Ryan Quigley, who writes for SB Nation’s Flyers website, tweeted that Provorov should be released from the team and that it isn’t even a “difficult decision.” (He then deleted it). His colleague, Madeline Campbell, said that it is “abundantly clear” that Provorov isn’t a team player, that he should be punished, and that “while the team is likely hoping that this all fizzles out soon, this is a stain that is going to stick with them for a while.”
That is, of course, a tacit threat. It’s a stain that is going to stick because she and her colleagues are going to continue to whine about it.
All of this outrage stems from one man not taking part in corporate pandering, because that corporate pandering makes woke sports “journalists” feel good. Sports media is convinced that gay hockey fans were emotionally woundedby something they wouldn’t know even happened if sports media didn’t obsess over it.
They think gay hockey fans are apparently incredibly fragile and must have
their lifestyle constantly affirmed by every public figure they see.
What players do or do not wear during warm-ups should almost never be a news story, and yet the sports media landscape is aflame with the tantrums of vindictive liberals who moved quickly from “stay out of our bedrooms” to “wear the rainbow jersey or else.” These aren’t people who want to cover hockey and keep hockey fans informed.
They are political activists who happen to work in sports media, and they will not rest until all dissenters have been shamed or silenced.
There is more than one way to ruin a perfectly good historical temperature record. The Australian Bureau of Meteorology achieves this in multiple ways, primarily through industrial scale remodelling (also known as homogenisation – stripping away the natural warming and cooling cycles that correspond with periods of drought and flooding), and also by scratching historical hottest day records, then there is the setting of limits on how cold a temperature can now be recorded and also by replacing mercury thermometers with temperature probes that are purpose-built, as far as I can tell, to record hotter for the same weather.
The Australian Bureau of Meteorology (BoM) regularly claims new record hot days, and Australian scientist report that heat records are now 12 times more likely than cold ones. But how reliable – how verifiable – are the new records?
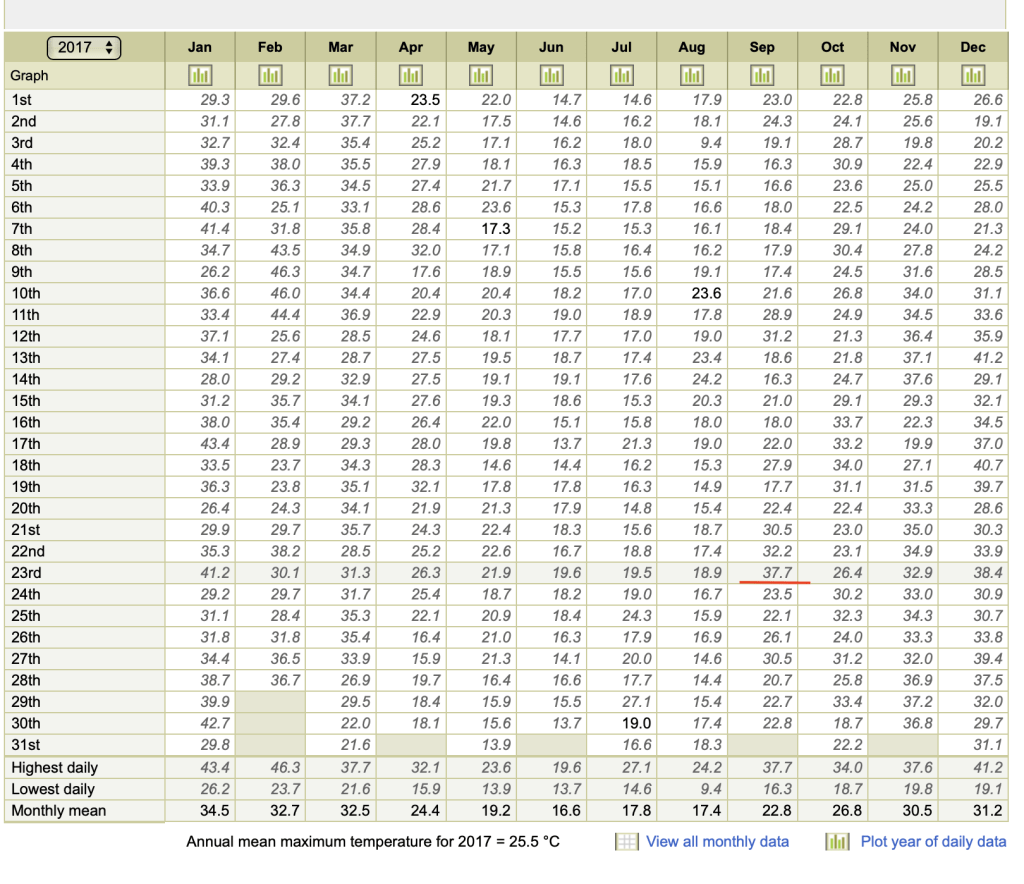
I have been trying for five years to verify the claim that the 23 September 2017 at Mildura was the hottest September day ever recorded in Victoria. According to media reporting at that time, it was the hottest September day all the way-back to 1889 when records first began. Except that back then, back in September 1889, maximum temperatures were recorded at Mildura with a mercury thermometer. Now they are recorded with a temperature probe that is more sensitive to fluctuations in temperature and can thus potentially record warmer for the same weather.
In the absence of any other influences, an instrument with a faster response time [temperature probe] will tend to record higher maximum and lower minimum temperatures than an instrument with a slower response time [mercury thermometer]. This is most clearly manifested as an increase in the mean diurnal range. At most locations, particularly in arid regions, it will also result in a slight increase in mean temperatures, as short-term fluctuations oftemperature are generally larger during the day than overnight.” Research Report No. 032, by Blair Trewin, BoM, October 2018, page 21.
To standardise recordings from temperature probes with mercury thermometers, one-second readings from probes are normally averaged over one minute – or batches of ten second readings are averaged and then averaged again over one minute. That is the world-wide standard to ensure recordings from temperature probes are comparable with recordings from mercury thermometers. But the Australian Bureau of Meteorology do not do this, instead they take one-second instantaneous readings and then enter the highest of these one-second spot readings for any given 24-hour period as the official maximum temperature for that day.
There is an easy way to test this.
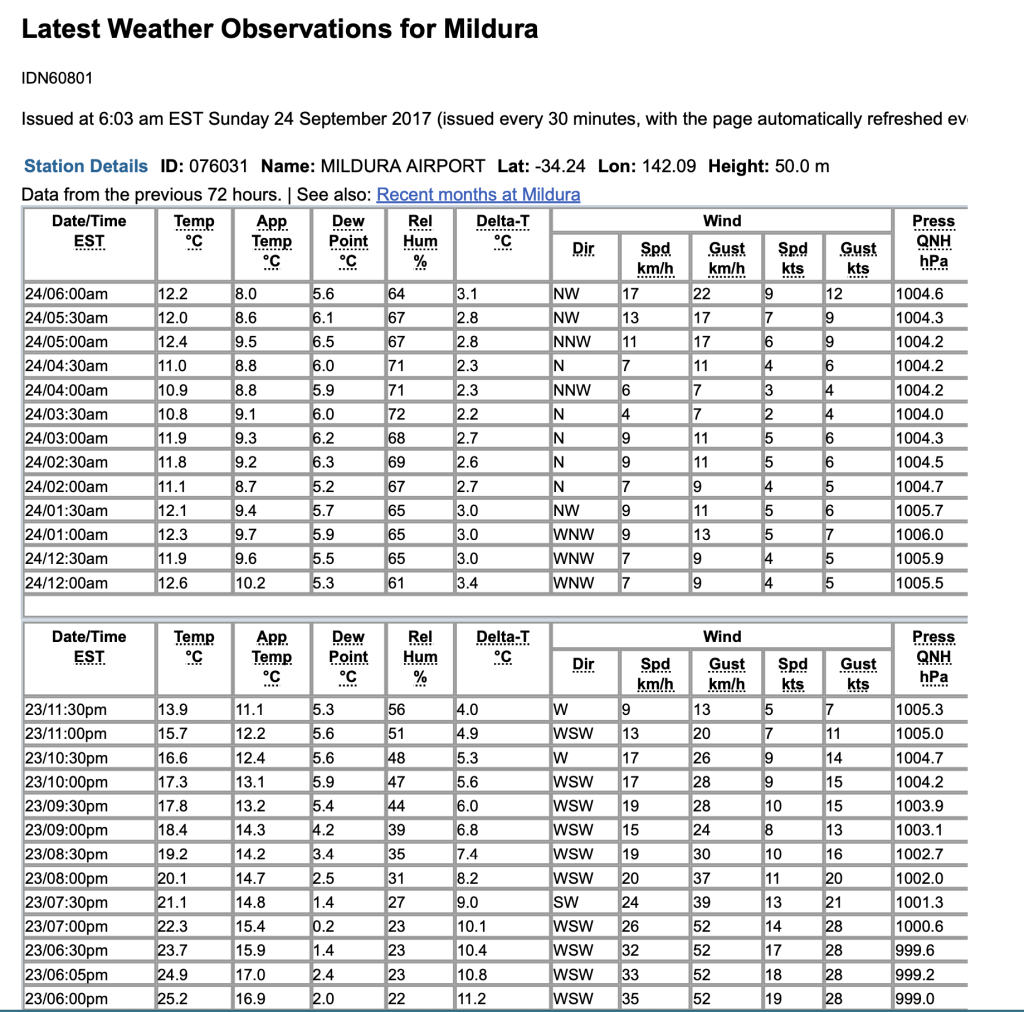
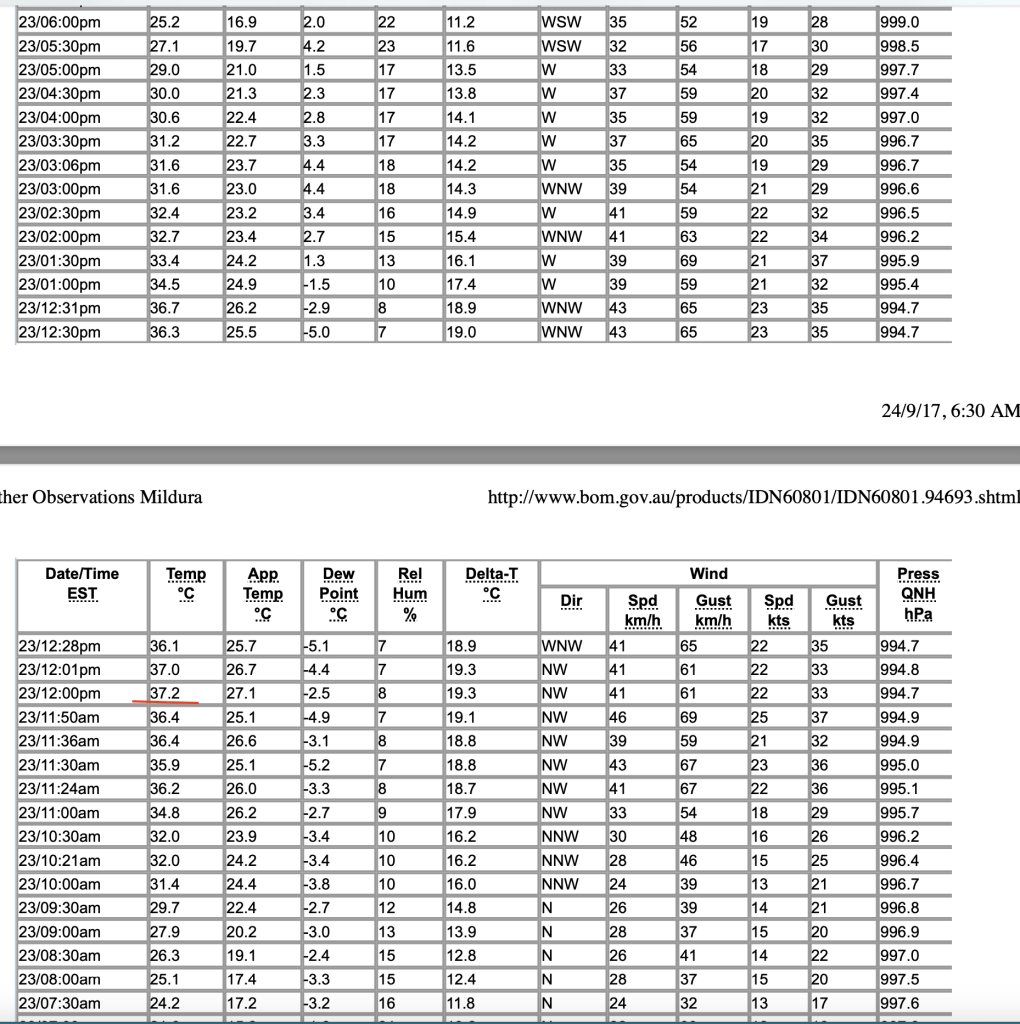
Many Australians check the ‘Latest Weather Observations’ for their local weather station online at the Bureau website, but few realize that the values they see there represent the last one-second recording for any given half hour period.
For example, for the 23rd September 2017, the highest value for that day as shown on the observations page for Mildura was 37.2 °C, recorded at 12:00pm.
Yet 37.7 °C was entered into the data archive as the official maximum temperature for 23rd September 2017 at Mildura.
This represents a discrepancy of 0.5 °C.
This is because the Bureau uses the highest one-second reading as the the maximum temperature for that day, while the last (not the highest or averaged) one-second reading for any 30-minute period is displayed on the ‘Latest Weather Observations’ page.
There is absolutely no averaging. None at all in direct contravention of international norms and standards.
This is confusing, most unconventional, and in fact ridiculous.
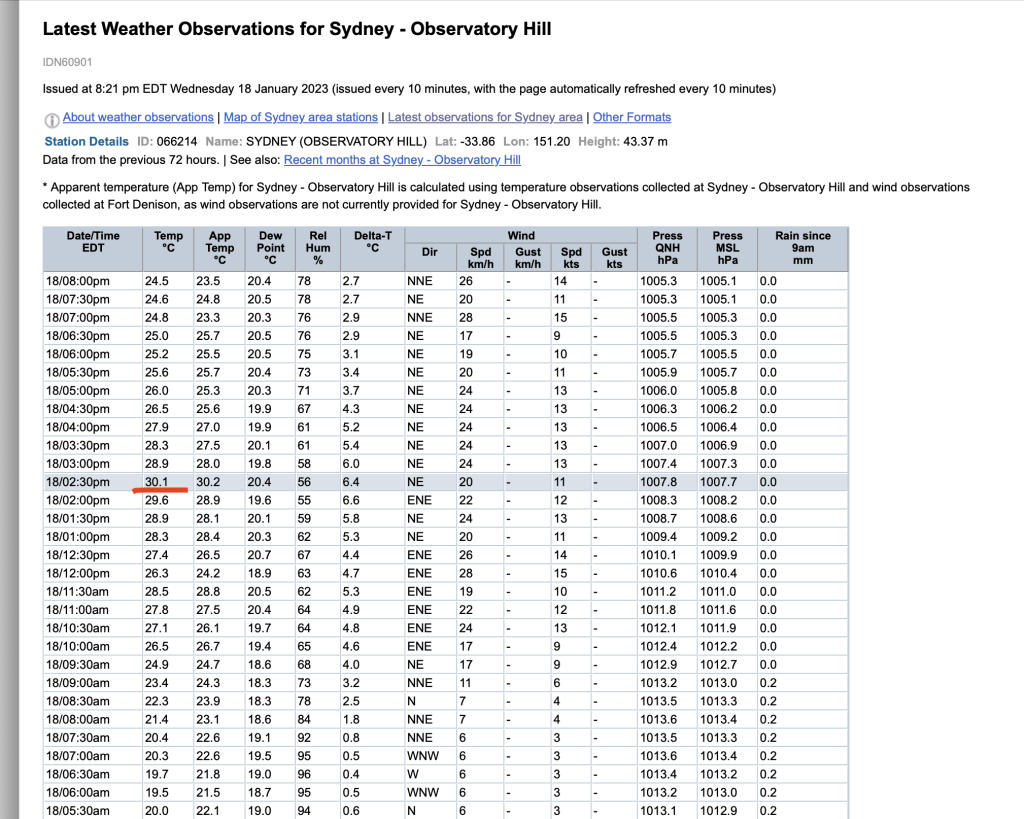
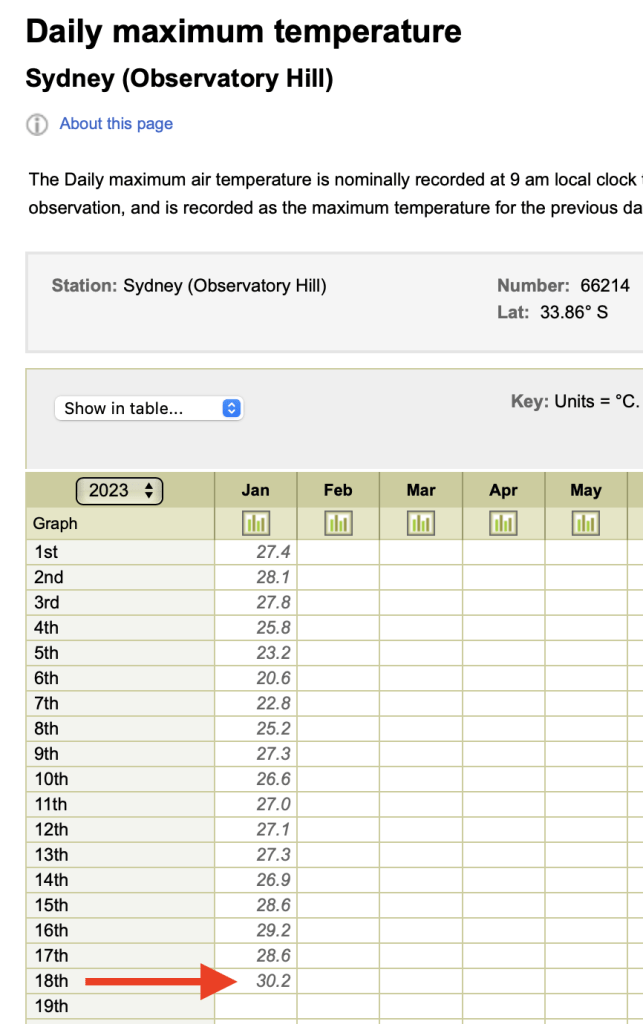
Consider the temperatures as recorded at Sydney’s Observatory Hill automatic weather station just yesterday, as another example.
Australia is a land of drought or flooding rains and so relatively hot years like 2017 tend to be followed by cooler years including the last three years. Until yesterday, 18th January 2023, Sydney apparently had its longest spell of days with temperatures below 30 °C in 140 years. And I watched as Chris Kenny on Sky Television last night made reference to this and showed the ‘Latest Weather Observations for Sydney – Observatory Hill’ with the temperature showing 30.1°C at 2.30pm.
I went online to the Bureau’s data archive to see the maximum temperature officially record for this weather station for 18th January 2023. At 9 am this morning, a different value was entered, the value of 30.2°C, giving a discrepancy of 0.1.
There is a discrepancy because the value on the ‘latest observations’ page is the last one second reading for that 30 minute period, while the value entered into the permanent archive is the highest one second reading for the entire day.
The World Meteorological Organisation (WMO) provides a clear definitions of daily maximum temperature. This temperature can be read directly from a mercury thermometer, but when using a temperature probe ‘instantaneous’ values must be averaged over one to ten minutes.
Back to Mildura and in summary, both the one second value of 37.2 °C shown for 12:00 pm on 23rd September 2017, and the different one second value of 37.7 °C recorded as the daily maximum temperature at Mildura on that same day are not compliant with any international standard and therefore are not verifiable or standardisable against the temperatures as officially recorded at Mildura using a mercury thermometer from January 1889 until 1 November 1996. It is thus disingenuous to claim a new record hot day back to 1889 for 23rd September 2017, because the temperature on 23rd September 2017 was measured with a different type of recording instrument (temperature probe) and in a non-compliant way (no averaging).
Theoretically it is possible to know how the values of 37.2 °C and 37.7 °C compare with a mercury thermometer for that location at that time of year as Mildura is meant to be a location with parallel measurements. That is measurements from both a probe and a mercury thermometer in the same automatic weather station recorded on what are known as A8 Forms.
I have been seeking this information for 34 different locations as part of a Freedom of Information Request, so far denied by the Bureau. An appeal against this is being heard in the Administrative Appeals Tribunal on 3rd February 2023 in Brisbane.
The current probe, the third for Mildura, was installed on 27th June 2012. As I will show in a future blog post in this series, this probe has a very different recording profile relative to the previous probes and the mercury thermometer.
There is theoretically parallel data (temperatures recorded from both probes and mercury) for Mildura for the period from 1 January 1989 until 28 January 2015, and many scanned A8 Forms were provided to me following the intervention of Minister Josh Frydenberg in November 2017. But the Bureau has so far withheld the A8 Forms pertaining to the entire month of September 2012. This is the only September for which there are parallel recordings with the same probe used to record the 23rd September 2017 claimed record hot day and a mercury thermometer.
Mildura has one of the longest temperature records for any where in the Murray Darling Basin region. The official data for this region shows a step increase in maximum temperatures for all months after the temperature probes became the official recording instrument beginning on 1 November 1996.
******
Consider subscribing for my irregular e-news updates by clicking here.
The IPCC’s position, based on a doubling of CO2 concentration (CO2x2), is that an initial warming at equilibrium of 1.1°C without feedback is increased nearly 3-fold to about 3.0°C by strong net positive feedback.
This strong net positive feedback to small initial warming from increased CO2 concentration implies several improbable outcomes.
Firstly, that CO2 must be the dominant control knob of the climate. A corollary of this is that nearly the entire 33°C Greenhouse effect would disappear if the 8°C CO2 component was removed. This despite the sun still beating strongly into the tropical oceans creating large quantities of water vapour, a strong GHG. In Lacis et al, 2010, the CO2 GHE was zeroed and consequently the modelled high feedback reduced global mean surface temperature by 34.8°C within 50 years. They used GISS 2° x 2.5° Model E (AR5 Version) to achieve this unlikely result.
Secondly, all the models that include this high net feedback are running too hot and have been falsified.
And thirdly, that there would be little or no change in temperature over the last few millennia followed by a sharp up-tick as CO2 concentrations increased from about 1950 onwards. The hockey stick graphs produced by the IPCC to support this narrative are very obviously either very poor science or corrupt. Take your pick.
The problem and paradox here is that all the IPCC’s known feedbacks when counted together produce a strong positive temperature reinforcement while real world measurements point to benign or even negative feedback.
WHAT IS THE IPCC’S NET CLIMATE FEEDBACK THAT CREATES THIS PARADOX
The IPCC AR4 (2007) defines its net climate feedback as follows.
In AOGCMs, the water vapour feedback constitutes by far the strongest feedback, with a multi-model mean and standard deviation for the MMD at PCMDI of 1.80 ± 0.18 W m–2 °C–1, followed by the (negative) lapse rate feedback (–0.84 ± 0.26 W m–2 °C–1) and the surface albedo feedback (0.26 ± 0.08 W m–2 °C-1). The cloud feedback mean is 0.69 W m–2 °C–1 with a very large inter-model spread of ±0.38 W m–2 °C–1 (Soden and Held, 2006).4
The IPCC AR6 (2019) changes some of these feedbacks significantly but ends up with approximately the same net feedback. The AR4 and AR6 feedbacks are compared in the table below. The lapse rate feedback (LRF) and the water vapour (WV) feedback have been combined in this table for comparison purposes.
FEEDBACK
AR4 (2007) (W/M-2 °C-1)
AR6 (2019) (W/M-2 °C-1)
Combined WV + LRF
0.96 ± 0.08
1.30 (1.15 to 1.47)
Albedo
0.26 ± 0.08
0.35 (0.1 to 0.6)
Cloud
0.69 ± 0.38
0.42 (-0.1 to 0.94)
Bio
N/A
-0.1 (-0.27 to 0.25)
Other (Approximate)
0.19
0.04
TOTAL
2.1
2.1
Table 1 – Global temperature feedback for CO2 doubling in the IPCC’s AR4 and AR6.
You can see that if we multiply the AR4 and AR6 total (2.1) by the standard conversion factor (ƛ) 0.3 then plug the result into the standard feedback equation, we get the IPCC’s likely temperature at equilibrium after all feedback has acted.
The first thing to notice here is that the IPCC’s cloud feedback parameter is believed to have fallen significantly between 2007 and 2019 with this fall compensated for by a large rise in combined WV and LRF. One of the readers here may be able to offer a good explanation for this but it does seem unlikely considering the fall in Global Relative Humidity recorded by the UK Met Office, figure 2, and discussed below.
The other thing to notice is that the IPCC’s high feedback leads us very close to a crazy discontinuity as can be seen in figure 1, below. For example, if the LRF was not relevant or was removed then Equilibrium Climate Sensitivity (ECS) (CO2x2) using the AR4 figures would become an improbable 9.16°C as per equation 2.
Equilibrium Climate Sensitivity (ECS) is increased by an improbable 6.16°C (9.16 – 3.0) simply by removing the LRF. This would occur, for example, if the hot spot above the tropics were less than expected or insignificant, something that appears to be the case. The atmosphere under this high feedback scenario would become very unstable and unlike the atmosphere we live with every day.
This may not be just wild conjecture as our understanding of average changes in emission at a warming average emission height are limited as can be seen by the IPCC’s large change in WV+LRF from 2007 to 2019. Although representing the same thing, they couldn’t even get their model spread (confidence limits) to overlap. What is going on here?
A consequence of this is that small changes in our understanding of the WV and LRF have a disproportionate effect on the estimated ECS.
This high net positive feedback to CO2x2 could, of course, be possible but to my mind is very unlikely, particularly given the temperature variation over recent millennia and the recent failure of the climate models that incorporate this high net feedback.
Figure 1 – Primary feedback compared to final equilibrium temperature, °C. Graph- Thanks to “The GH Defect…saving the planet from idiocy”.
To counter the IPCC’s high feedback, sceptical types like myself need to come up with a feasible alternate scenario. This is what I have tried to do in the next section.
POSSIBLE REASONS WHY NET CLIMATE FEEDBACK IS BENIGN OR POSSIBLY NEGATIVE
There are several possible reasons why net feedback could be significantly lower than the IPCC’s published range as outlined in table 1 including various negative cloud feedbacks that have not to date been included by the climate models. In addition to these the possibility that decreasing relative humidity would significantly lower feedback response in a warming world is discussed below.
Global Specific Humidity is following global temperature very closely, so the atmosphere is accumulating moisture as it warms. The problem for the climate models is that they assume that Global Relative Humidity will remain steady or increase slightly over the oceans as the planet warms. This is simply not happening according to the UK Met Office with significant implications for the WV feedback and its partner the LRF.
How much this would affect ECS and our understanding of the WV/LRF feedback is hard to say. What we can say is that it should increase the negative LRF feedback significantly compared to the positive WV feedback. The modelled signature of this WV feedback is a distinct warming high above the tropics. This has not occurred as expected and has caused many to doubt the models in this area. The falling Relative Humidity over the oceans could be related to and possibly help to explain the failure of this hot spot to materialize.
Figure 2 – Global time series of annual average relative humidity for the land (green line), ocean (blue) and global average (dark blue), relative to 1981-2010. The two-standard deviation ranges for uncertainty are shown combining the observation, sampling and coverage uncertainty. Credit: Met Office Climate Dashboard
Figure 3 – Global time series of annual average specific humidity for the land (green line), ocean (blue) and global average (dark blue), relative to 1981-2010. The two-standard deviation ranges for uncertainty are shown combining the observation, sampling and coverage uncertainty. Credit: Met Office Climate Dashboard.
Note: The Specific Humidity as seen in Figure 3 bears a striking resemblance to the UAH satellite temperature series while not matching the NASA GISS series well at all.
Bony et al. discuss the relationship between Relative Humidity and feedback in the climate system below.
“As illustrated in Fig. 12, the free troposphere is particularly critical for the watervapor feedback, because humidity changes higher up have more radiative effect (Shine and Sinha 1991; Spencer and Braswell 1997; Held and Soden 2000; Marsden and Valero 2004; Forster and Collins 2004; Inamdar et al. 2004). In the Tropics, the upper troposphere is also where the temperature change associated with a given surface warming is the largest, owing to the dependence of moist adiabats on temperature. If relative humidity changes little, a warming of the tropical troposphere is thus associated with a negative lapse rate feedback and a positive upper-tropospheric water vapor feedback. As explained by Cess (1975), this explains a large part of the anticorrelation discussed in the introduction between the water vapor and lapse rate feedbacks of climate models (Fig. 1). It explains also why the magnitude of relative humidity changes matters so much for the magnitude of the combined water vapor–lapse rate feedbacks: a change in relative humidity alters the radiative compensation between the water vapor and lapse rate variations, so that an increase (decrease) in relative humidity will enhance (lessen) the water vapor feedback relative to the lapse rate feedback.”
The IPCC has indicated many times that they believe the science around global climate feedback is settled. How can this be reconciled with the published WV/LRF increasing significantly between their 2007 report and their 2019 report (Table 1). The published confidence limits don’t even overlap.
The climate model expectation is that relative humidity should remain steady or rise slightly with increased temperature. This is not happening (Figure 2) and cannot be reconciled with the large rise in WV/LRF between the 2007 and 2019 IPCC reports.
Unless somebody has a better explanation, it seems likely that the IPCC needed to keep the 3.0°C ECS for political reasons and simply altered the various feedback parameters to suit.