Climate science stance amounts to a gross misrepresentation of reality
The DIY way to demystify “greenhouse gas” claims
By Fred F. Mueller
Part 2

Fig. 1. The sun and the clouds – here a thin cover of high clouds and some aviation chemtrails – are the main driving forces for the energy fluxes determining our climate. The “greenhouse gases” are – if ever – just a minor factor.
In Part 1, we looked at the deplorable tendency of climate doomsayers to reduce the factual complexity and variability of parameters influencing our climate by focusing on a single aspect – the so-called “greenhouse gases” – and among these on the declared most odious villain: CO2. Its content in the atmosphere is declared to be the one and only factor 1) that determines our climate and hence earth’s temperature.
The efficiency of this one parameter is attributed to the power to restrain the currently positive planet-wide temperature trend to within + 1.5 °C, thus urging politicians to set a residual CO2 budget 2) of 400 billion tonnes subdivided and allocated to each nation within narrow allowances. These national budgets are then again subdivided and enforced onto the different sectors of industry and the population with grave consequences for the welfare of society, e.g. cement and metal production, building and heating standards or private car use.
Any other variables affecting the energy budget of our planet such as water vapor, actually a much more potent “greenhouse gas” than CO2, are simply ignored by treating them either as constants or as mere amplifying factors. The influence of clouds – the other aggregate states of water in the atmosphere – is simply and willfully suppressed.
Interesting discrepancies with respect to clouds
One of the most striking methodical imprecisions (if not outright untruths) of current climate science is demonstrated when looking at Fig. 2, a diagram elaborated by NASA that purports to convey a realistic impression of the energy fluxes on earth’s surface and in the atmosphere.
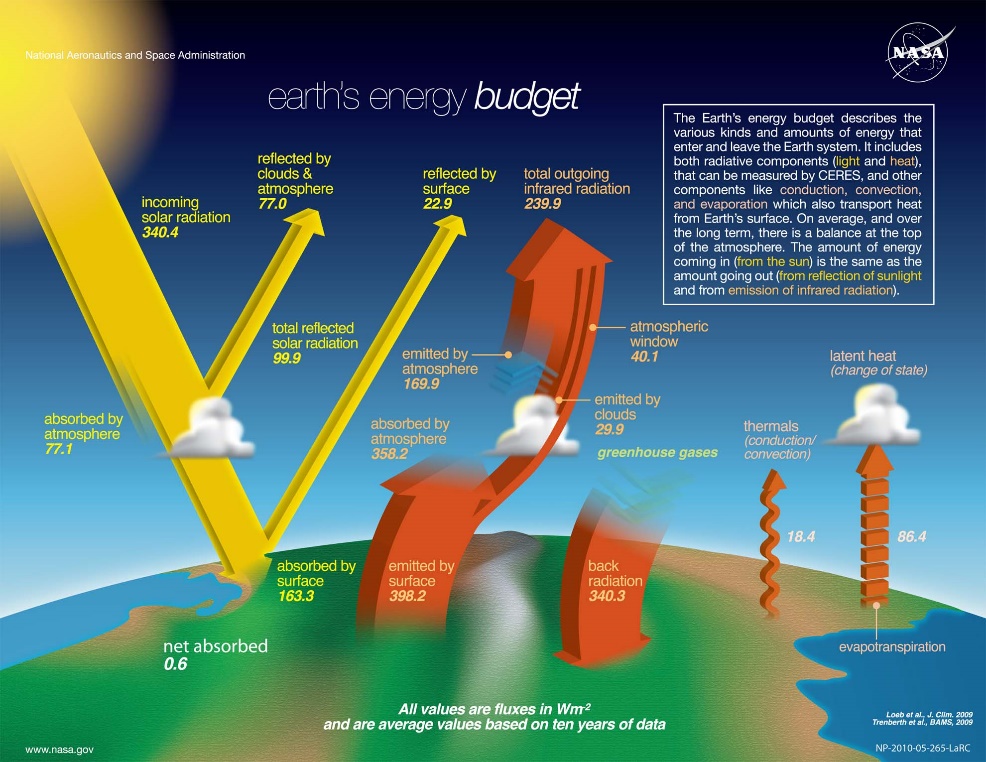
Fig. 2. This representation of the energy flux densities on earth elaborated by NASA is misleading with respect to some decisive facts (Chart by NASA 3), public domain. Note: This picture and the corresponding link have been withdrawn after completion of the article. In a subsequent part, the replacement graphic and its amendments will be treated in detail. Nevertheless, this graphic and its errors have been displayed for a prolonged time, thus warranting a suited discussion).
The chart is, to put it politely, a bit misleading when it comes to the role of clouds. In this graphic we see, from left to right, just three representations of clouds. The cloud symbol to the left does not absorb any energy; its only role is to reflect incoming solar radiation, together with the atmosphere and without detailing the share of both participants.
In the center, the cloud is an emitting-only entity (!) radiating 29.9 W/m2 towards outer space through the atmospheric window without any discernible energy input. And finally, the cloud symbol on the right is soaking up a constant power input of 86.4 W/m2 without any discernible output. For anybody having had a basic scientific education, this leaves question marks. And even if we piece together the different input and output figures related to clouds, we are left with an unexplained balance difference of +56.5 W/m2. This discrepancy warrants a certain degree of suspicion with respect to the presented role of clouds within the atmospheric energy fluxes.

Fig. 3. The sun’s global radiation input flow density over two days in July 2022 lying close to each other with strongly different cloud cover (Graphic: Author, own calculation with values taken from Kachelmannwetter 4)
Clouds – an elusive yet decisive climate variable
To this end, we will look at clouds with a strict focus on macroscopic energy fluxes. Clouds are the result of the over-saturation of air with water vapor as a result of falling temperatures, resulting in the formation of microscopic water droplets or ice crystals inside an air bubble that is saturated to 100% with water vapor und contains a certain amount of aerosol particles that serve as seeds for the condensation. The main difference to air merely saturated to 100% with water vapor but containing neither droplets nor ice particles is that the pure water vapor is fully transparent while the cloud is visible and can displays an amazing variety of sizes, shapes and colors.
Cooling: clouds prevent sun’s energy from reaching the earth
In a first approach, we will omit all other aspects with the exception of the reflection, absorption and emission of light, be it visible or infrared. Contrary to water vapor that is reacting with Infrared (IR) photons exclusively in molecule-specific frequency bands, the tiny particles within clouds interact with all radiation photons just like any solid or liquid bodies. The particles deflect, break or reflect visible light, e.g. forming rainbows under certain conditions, and also absorb light of all wavelengths, as can be seen by the changing color of cumulus clouds that appear brilliant white at the top and become darker towards their bottom.
229 times greater than CO2
Due to their very different sizes and structures, their reflectance (also called albedo) 5) – e.g. the fraction of incoming sunlight that will be reflected back into space – can vary between 10% for cirrus clouds and up to 90% for cumulonimbus clouds. In other words, a big cloud may prevent up to 90% of the incoming solar energy from reaching the earth’s surface. This means that during daytime, the ever-changing cloud cover of earth functions just like a variable lid or filter determining how much energy input we receive at surface level. The max difference of energy flux densities between these two days amounts to 715 W/m2, see Fig 4:

Fig 4. This graphic shows the absolute differences between the solar energy flux densities of July 2nd and July 7th, 2022 in the Konstanz region of Germany. The black line representing the 3.11 W/m2 attributed to the combined effect of greenhouse gases cannot even be discerned from the x-axis.
This max difference of 715 W/m2 is more than 229 times the 3.11 W/m2 attributed to the climate effect of the main greenhouse gases. In Fig 4, the corresponding black line can’t even be discerned from the x-axis. One doesn’t have to be a rocket scientist to understand this relationship. Everybody’s practical experience confirms the fact that a noticeable cloud cover will prevent ambient temperatures from climbing as high than would be the case in sunnier conditions.
Worse still for the narrative of “water vapor reinforcement” currently advanced by our climate science pundits, the cumulated solar input flux density for both days amounts to 7.2 kWh and 4.1 kWh respectively, while by comparison the 24-h-effect attributed to the greenhouse gases adds up to just 0.075 kWh. The difference between the solar input for both days is 3.1 kWh, a figure that is 40 times higher than the alleged climate sensitivity contribution of greenhouse gases.
Warming: clouds emit substantial quantities of IR energy
Furthermore, clouds do not only block enormous quantities of solar energy from reaching the soil by reflecting the related radiation back into space, they have another characteristic that can best be understood by assuming that when it comes to IR radiation energy: they behave like massive bodies (in reality, the exact mechanism is more complicated). Don’t be fooled by the fact that clouds seem to have no mass, hovering high in the air without losing height and being blown around at the mercy of the winds. Despite their apparent weightlessness, clouds have an important mass sometimes even exceeding one metric ton per square meter. This becomes obvious when their water content comes down to earth as rain. Just 50 mm of rain translate to a water mass of 50 kg/m2, and the corresponding clouds will usually continue their path towards the horizon without showing signs of thinning or fading away. A collection of extreme weather events assembled by the World Meteorological Organisation 6) lists a 1-hour rainfall of 305 mm and a 12-hour rainfall of 1,144 mm, which translates to water masses of 305 kg and 1,144 kg per square meter of cloud cover.
These considerable masses of water above in the sky emit IR radiation characterizing their temperature in line with the physical law established by Stefan and Boltzmann 7). On rainy days, the base of bad weather clouds often comes down to just a few hundred meters above ground. It has the temperature of the ambient air at this altitude, which can be estimated as being about 2-5 °C below the temperature at ground level (the air temperature usually drops by approximately 6.5 °C over a height gain of 1,000 m). Knowing the temperature of the cloud base thus yields the input for calculating the IR output flux density of the cloud towards the soil. This brings us to the first interesting DIY tip when trying to assess energy flows in the system earth/atmosphere for the given location, see Fig. 5:

Fig. 5. With modern infrared surface temperature sensing instruments (1) available in DIY shops, one can easily measure the surface temperature of the soil and of the base of clouds. (2)=soil temperature Jan. 13th, 2013, (4)=cloud cover overhead and (5)=the respective temperature value.
Assessing a cloud’s downward IR radiation
Sophisticated instruments enable meteorologists to accurately measure the downward IR emission flux density from clouds and other sources (such as the clear sky atmosphere without clouds, mainly containing water vapor, aerosols and greenhouse gases). At the same time, advancements in the mass production of IR thermometry has also given the public the ability to buy a fairly viable instrument for just a few dozen bucks at the local DIY shop (by the way, for measuring clouds, a model with a min temperature limit of about -50°C might be preferable to one limited to only – 20°C).
With such equipment, it is astonishingly easy to measure the temperature of the soil and the cloud base at the same place within just a minute or so, see Fig 5. Take care to measure directly on the soil (bare earth or short lawn) (2), since especially on hot summer days, stones, metals and asphalt (3) can reach temperatures exceeding soil levels by sometimes more than 10 °C. On the other hand, clouds that are too thin such as cirrus clouds (6) will not deliver valid readings. Avoid trying to measure individual clouds surrounded by clear sky since the instrument has a rather wide-angled input cone and will almost inevitably include portions of clear sky causing it to deliver an invalid reading.
Measuring ground and clouds should be performed as vertically as possible und always at the same date and time. On a side note, such IR thermometers can help you in your home in the winter to assess the quality of your outer wall insulation. Just compare the readings from inner and outer walls (or windows) or the values from the middle of your outer wall with those obtained from the corner where that most darned mold stain keeps reappearing despite the chemicals you used to combat it.
How to calculate IR energy flux densities from surface temperatures
Thanks to the availability of such simple and pricey means to measure soil as well as cloud base temperatures, even laymen can easily calculate two of the four main radiation energy flux densities that influence the energy balance at a given location. These “big four” are (1) the local global solar radiation 8), (2) the upwelling IR radiation governed by the current surface temperature at ground level and (3) the downwelling IR radiation emanating from the cloud cover. The first figure can be obtained by scanning the homepages of your local weather stations for one that has the instrumentation to perform this task. Additionally, several other important energy transport mechanisms such as convection and rain have for now been left aside in order to facilitate the basic understanding of the energy fluxes determined by radiation, since in this chapter, we focus on the radiative mechanisms assigned to the so-called “greenhouse gases”.
Going forward, we first look at an easy way to assess factors (2) and (3). As already mentioned in Part 1, there are internet service providers such as Spectralcalc 9) that can be freely accessed where one can input temperature values and instantly gets a figure (and ideally a graph) for the power flux density of the IR radiation emitted by a surface. (The results presented here were checked against figures published by a well-equipped meteorological station in Germany 10). The differences were just in the low one-digit percentage range). When keying in the figures, keep in mind that in the relevant temperature range, emissivity values are very close to one and that the wavelength output boundaries should be set to 4 and 40 µm.
Furthermore, check if you have selected the correct temperature scale (°C or Kelvin). Using the values taken from Fig. 5, this gives us the energy flux densities shown in Fig. 6:
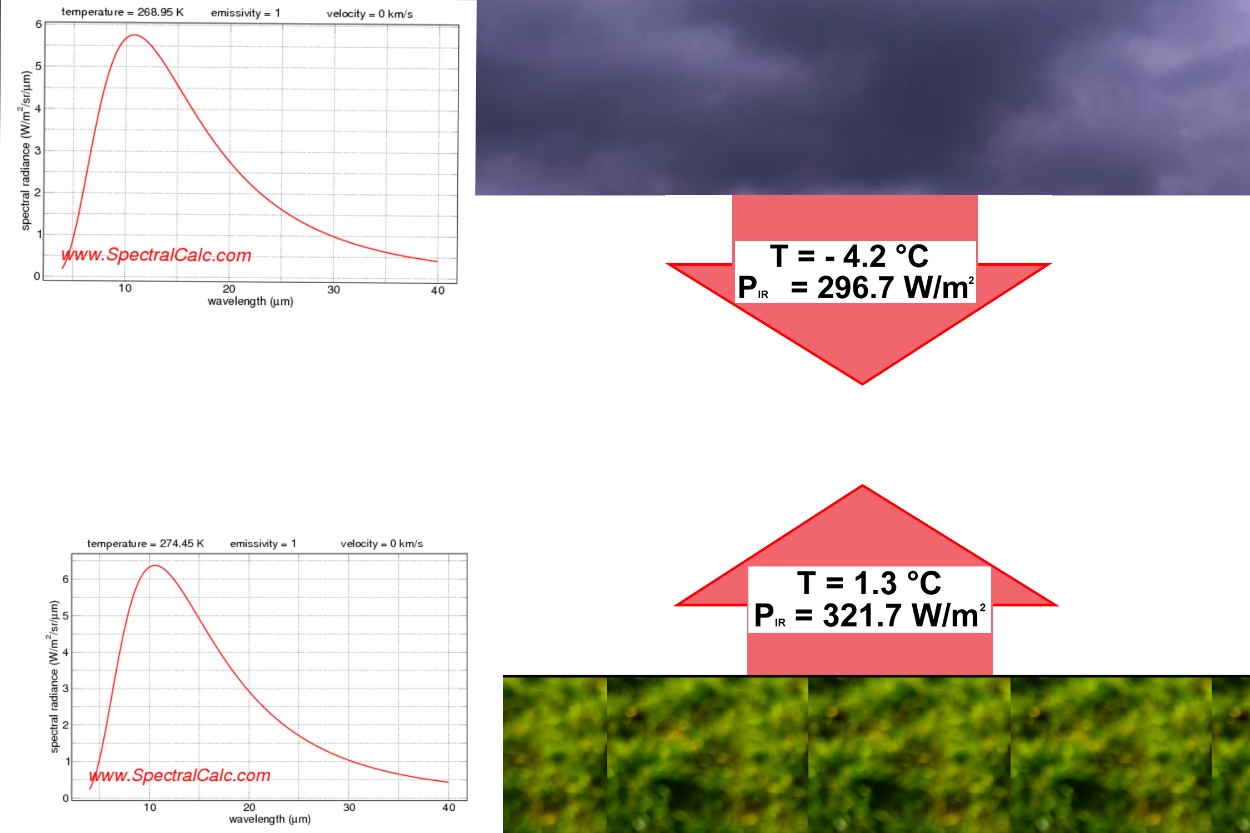
Fig. 6. Energy flux densities of IR radiation from the soil and from a compact cloud cover hovering probably some 800 meters above (Graphics: Spectralcalc 9), author)
Just to again compare orders of magnitude, the downwelling radiation density of about 297 W/m2 emanating from the cloud is 95 times higher as the alleged “radiative forcing” effect of the main “greenhouse gases”.
(For readers wanting to perform such calculations themselves, Fig. 7. shows a simplified equation that will deliver reasonably accurate results):
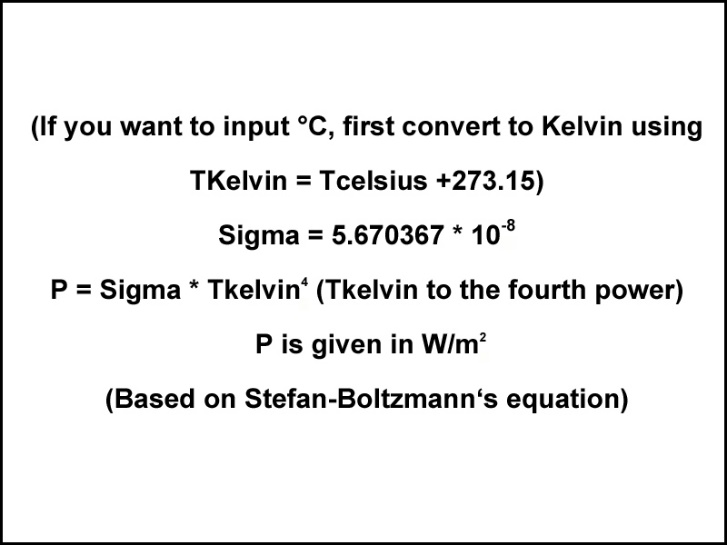
Fig. 7. A simplified calculation for IR emissions delivering the flux density in W/m2
The decisive dual role of clouds
As has been demonstrated, the measurement results are not in line with the official climate science that largely exaggerates the influence of CO2 and the other “greenhouse gases” while at the same time withholding the decisive role of water in its disregarded aggregate states in the atmosphere, e.g. when it condensates to droplets ore ice particles forming clouds. This official stance amounts to a gross misrepresentation of reality as has been shown in this chapter.
Clouds dwarf the alleged contribution of “greenhouse gases”
Clouds play a dual role in the transfer of energy in the atmosphere. Putting aside for the moment energy transfer by other mechanisms such as evaporation/condensation and convection, we have seen that just by blocking sunlight input by day and emitting downwelling IR radiation by day as well as by night, clouds can act as coolant and heating agents transmitting or blocking energy in quantities that literally dwarf the alleged contribution of “greenhouse gases”. Another factor that also has to be taken into account is the blocking of the IR radiation earth’s surface is constantly emitting. Clouds can absorb a very high percentage of this radiation and re-emit a large portion of it back downwards, thus trapping it inside the system earth/atmosphere, a role some climate pundits attribute solely to “greenhouse gases”, as demonstrated by Fig. 8., see also the first chapter of this article 11).
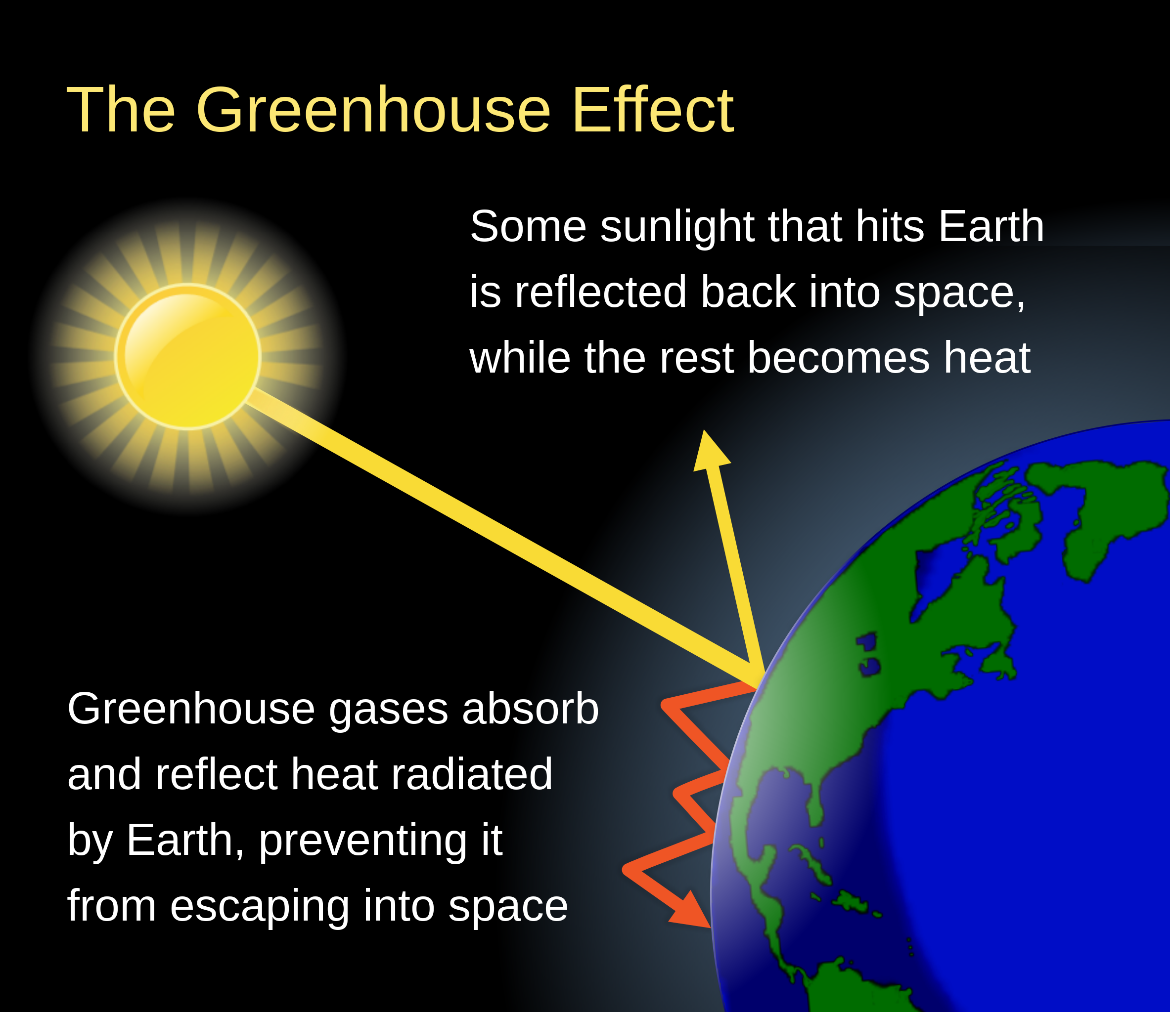
Fig. 8. The misleading cloud-free lead-in picture of the Wikipedia chapter about the “greenhouse effect” (Author: Efbrazil 12), CC 4.0).
The climate reality is thus shaped to a large extent by a complex interaction of all functions of clouds – including downpour, convection, radiative warming and radiative cooling – in combinations that the currently available science cannot model and, even less so, credibly forecast.
Meteorological stations should urgently be upgraded
It should be noted that a given cloud can change its overall function from warming to cooling according to the time of day. These interactions should be monitored with sophisticated equipment that up to now, not many meteorological stations have at their disposal. Keeping in mind that climate is defined as the average course of weather conditions for a particular location over a period of many years, this implies that the existing networks of meteorological stations should urgently be upgraded with the necessary instruments, software and workforce training.
The next part will look at some interesting professional-level meteorological results underscoring the fact that clouds, not greenhouse gases, and energy balances, not air temperatures 2 m above ground are the decisive levers to assess changes in our climate.
Stay tuned.
Sources:
2) https://www.carbonindependent.org/122.html#:~:text=This%20400%20between%20countries
3) The figure and the corresponding link were removed from the Internet after completion of this article.
5) https://www.nln.geos.ed.ac.uk/courses/english/ars/a3110/a3110008.htm
7) https://en.wikipedia.org/wiki/Thermal_radiation
8) https://www.smhi.se/en/climate/climate-indicators/climate-indicators-global-radiation-1.91484
9) https://www.spectralcalc.com/blackbody_calculator/blackbody.php
10) https://wettermast.uni-hamburg.de/frame.php?doc=Home.htm
12) https://en.wikipedia.org/wiki/Greenhouse_effect
Donate – choose an amount
via NoTricksZone
January 18, 2023 at 01:09PM