“the biggest victims of the war in Ukraine are the tens of thousands of Ukrainian men forced against their will as conscripts to serve as cannon fodder so that empty and weak Western losers like you can feel a sense … Continue reading →
Since Graham Lloyd’s article ‘Mercury Rising in BOM probe row’ was published on the front page of The Weekend Australian earlier this month, there has been some confusion regarding the availability of the parallel temperature data.
These are the temperatures handwritten into the Field Books of Meteorological Observations, both the temperatures as recorded by a mercury thermometer, and from the platinum resistance probes, at the same place and on the same day.
I spent the first of several minutes of a prerecorded interview with Michael Condon from ABC NSW Country Hour earlier this month arguing with him about this. He was repeating wrong information from the Bureau of Meteorology’s Chief Customer Officer, Peter Stone.
Specifically, Condon incorrectly claimed that the bureau makes all its temperature data publicly available on its website, including the parallel data. This claim, that is apparently being repeated across university campuses, flatly contradicts the opening paragraphs of Lloyd’s article. Lloyd correctly explained that it was only after a Freedom of Information request and three years of arguing with the Bureau (including over the very existence of these Field Books/A8 reports and whether their release was in the public interest), and then the case eventually going to the Administrative Appeals Tribunal on February 3, that some of the parallel data for Brisbane Airport was released.
So begins an article on page 13 of today’s The Australian, with the same article available online, click here ($ subscription required).
As Lloyd reported early this month, only three years of the 15 years of data for Brisbane airport was released to John Abbot on the Thursday before Easter and this is just a fraction of the 760 years of parallel data the bureau holds for 38 different locations spread across the landmass of Australia.
I’ve had several academics phone and email me over the last few days asking for assistance in locating the parallel data for Brisbane Airport online. I have explained that this was never provided to me in an electronic form, but as over a thousand handwritten pages. I manually transcribed the handwritten entries over Easter and undertook preliminary analysis of this data.
My analysis of the three years of parallel temperature data from Brisbane Airport shows that 41% of the time the probe is recording hotter than the mercury, and 26% of the time cooler. The difference is statistically significant (paired t Test, n = 1094, p < 0.05). The differences are not randomly distributed, and there is a distinct discontinuity after December 2019.
I initially thought that this step-change from an average monthly difference of minus 0.28C in December 2019 to plus 0.11 in January 2020 (a difference of 0.39C) represented recalibration of the probe.
The bureau has denied this, explaining there was a fault in the automatic weather station that was immediately fixed and operating within specifications from January 2020 onwards. Yet even after January 2020, the probe was recording up to 0.7C warmer than the mercury thermometer at Brisbane Airport.
Chart 1. The difference in the daily values for Brisbane Airport as recorded by the resistance probe minus the mercury thermometer.
The bureau does not dispute my findings. It has not provided its own analysis of the data beyond claiming that its own assessment of the full 2019-2022 period finds ‘no significant difference between the probe and mercury thermometer’.
I understood this to mean that the Bureau finds no statistically significant difference, but two academics, without seeing or analysing this data, have separately indicated to me that: The Bureau are just correctly saying that the differences are small. They are making no statistical claims. These same academics, having read Lloyd’s article in the Weekend Australian, know that the difference between measurements from the probe and mercury can be up to 1.9C – this is how much the mercury recorded warmer than the probe on one occasion. More usually the probe recorded warmer than the mercury. Yet they insist, and I quote: The Bureau’s rebuttal makes no claim of statistical testing. They are just saying that differences are within tolerance.
It seems that some Australian academics are on the one hand, quite prepared to claim that we should be fearful of temperatures exceeding a 1.5C tipping point, yet at the same be unconcerned about the accuracy or otherwise of measurements from official bureau weather stations.
The question for me continues to be whether the probes that have replaced mercury thermometers at most of the Bureaus’ 700 official weather stations, are recording the same temperatures that would have been recorded using a mercury thermometer.
In his letter to the editor of The Australian on April 19, the bureau’s chief executive, Andrew Johnson, explains that they follow all the World Meteorological Organisation rules when it comes to measuring temperatures. This is as absurd as the bureau’s Peter Stone claiming that all the parallel data is online.
The Bureau is unique in the world in taking instantaneous readings from the probes and using the highest in any 24-hour period as the maximum temperature for that day.
In the US, one-second samples are numerically averaged over five minutes, with the highest average over a five minute period recorded as the daily maximum temperature.
This is to achieve some equivalence with traditional mercury thermometers that have a slower response time, more inertia.
In contrast here in Australia, the bureau, use the highest instantaneous spot readings as the maximum temperature for that day. So, depending on how the probe is calibrated, it can generate new record hot days for the same weather.
This is an extract from the Brisbane Airport Field Book. Temperatures as shown were recorded on 1st August 2019.
I am also grateful that Ross Cameron from TNTRadio has indicated he will follow this saga, and has interviewed me the last two Sunday’s with the show available as a podcast, click here.
You can listen to a fair edit (about 10 minutes of the 50 minute conversation) of my prerecorded interview with Michael Condon on the ABC Country Hour by clicking here. I begin at about 11 minutes.
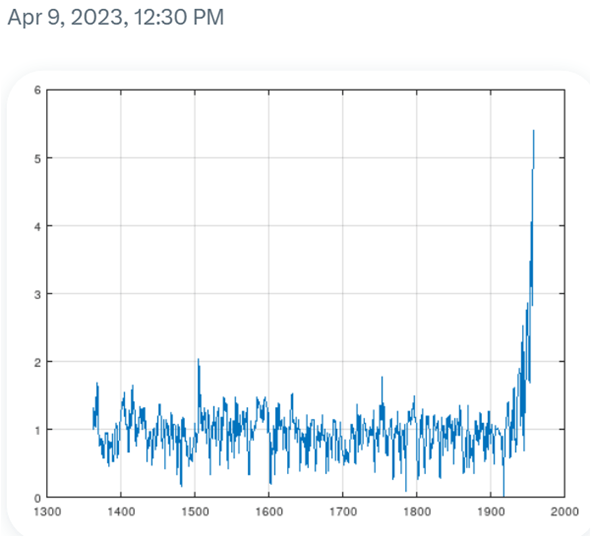
Chart 2. The monthly difference between the probe and the mercury for Brisbane Airport and also Mildura Airport.
Note from Anthony:For those of you that remember the yeoman’s work that Steve McIntyre did at Climate Audit debunking Michael Mann’s hockey stick and flawed methodology this should come as no surprise. Once again, hockey sticks get generated where the original data doesn’t show it. The only conclusion you can make is that the data and the method have been adjusted to fit a preconceived and desired result. This series of Tweets has been compiled here for easier access and readability. – Anthony
[M]ost readers are familiar with famous “hide the decline” from Climategate. Below are 1850-2000 parts of 5 series calculated from Asian tree ring data, explained below. I recently received some fantastic PAGES2k reverse engineering from @detgodehab and am re-visiting.
The data illustrated below comes from
(1) original Briffa 2001 Asian series with late 20th century decline (chopped off in Mann’s IPCC diagram);
(2) average of Asian series in gridded MXD series sent by Briffa/Osborn to Rutherford and Mann, ostensible input in Mann 2008
(3) average of (the 45) gridded MXD as used in Mann 2008. As discussed long ago at Climate Audit, Mann chopped off the offending declines and replaced them with temperature data. This was a different incident to the IPCC diagram or the 1999 WMO “hide the decline” diagram.
(4) PAGES2K (2013) introduced a novel Asia reconstruction (Cook et al) from tree rings in which late 20th C decline observed in Schweingruber data did not exist. Closing values were similar to high values at mid-20th century. The difference was not reconciled by PAGES2K.
(5) the current PAGES reconstruction – the “Woke Reconstruction” for short and used in IPCC AR6 – contained a subset of the PAGES2K Asia dset, the average of which yields a monster blade. The “decline” is in the Woke rear-view mirror.
A few years ago, I had noticed that some of the tree ring chronologies underlying the Woke Reconstruction had enormous closing blades that did not appear possible to replicate using standard methodologies.
I did a couple of Twitter threads as well:
I asked two lead authors of PAGES 2019 about the provenance of the Asian tree ring series, but got nowhere. They didn’t consider that they had any responsibility as lead authors of a Nature article to answer questions about their data.
The underlying reference (Cook et al 2013) contained only a single sentence as purported description of chronology methodology: that they took “considerable care” to avoid ‘segment length curse’, with “partial use” of a novel technique then recently introduced by UEA’s Tom Melvin
the keepers of these chronologies were at Columbia U which resolutely refused data when I was trying to figure out Hockey Stick mysteries. Jacoby: “Fifteen years is not a delay. It is a time for poorer quality data to be neglected and not archived.”
anyway, reader @detodehab got intrigued with the puzzling Asian tree ring chronologies and reverse engineered their calculation. He replicated the results to every detail. No one could have possibly imagined the actual calculation from details in PAGES2K or Cook et al 2013.
It’s hard for a statistical methodology to be so bad as to be “wrong”. Mann’s principal components methodology was one seemingly unique example. PAGES2K’s Asian tree ring chronologies are another. It’s worse than anyone can imagine.
unfortunately, exposition of the defective calculation are technical and will take some time. But for now, the monster blade of the “Woke” PAGES 2019 Asian tree ring data is bogus. PAGES2019 selectively chose the biggest blades, nearly all of which come from bogus chronologies.
I have a question for readers on order of exposition. Which should come first:
1) narrative of detective work by which calculation was reverse engineered
2) pathologies of PAGES2K Asia tree ring methodology
Not all Asia chronologies are pathological, but biggest blades are.
on the left is description of PAGES Asia2K chronologies and on right is my brief description of their actual algorithm as deduced by @detgodehab and verified by me. I’ll return later to how he figured this out. For now, the pathologies of the method.
I’ll describe the pathologies of the PAGES2K Asia algorithm more or less as we discussed them in DMs over past few weeks. @detgodehab had begun with analysis of paki033, the series that I had featured in a 2021 thread and blog article.
@detgodehab had ported the algorithm to Octave. The paki033 iteration stopped after 20 iterations. So let’s look at the evolution of the chronology. It opened as nondescript series on left and closed with big blade. On right is sequence of steps showing emergence of closing blade
what happened to individual cores? Tree ring “chronologies” are calculated as the difference between measurements and smooth (pseudo-model). Between start and close, the ‘model’ moved closer to zero at the close, so that contribution to chronology (shown on right) increased bigly
this looked very suspicious as a procedure. An obvious question was whether the monster blades in certain PAGES2K chronologies were some sort of artefact, as opposed to “climate”. So I suggested that @detgodehab see what happens when last 50 years of data not used? As a test.
bingo. Excluding the last 50 years of data, paki033 had an even bigger blade //50 years earlier//. For good measure, @detgodehab did test excluding 25 years and got same big blade //25 years earlier//.
so it was very clear that the big blade being produced by the PAGES2K Asia chronologies was bogus and some sort of artefact of their methodology and NOT due to climate. This doesn’t disprove global warming. It is only relevant to PAGES2K.
Also, PAGES2K uses much other data. Nor are all Asia 2K chronologies calculated with this bogus methodology. But PAGES2019 selected the worst and most bogus chronologies (claiming they were the best) and that’s why there’s the monster blade shown in opening tweet.
while it’s evident that the PAGES2K Asia methodology was pathological, when @detgodehab chopped off 100 years, it didn’t produce a blade. I haven’t parsed this to see why. There are many mysteries in the algorithm which I’ll continue to describe.
In an iteration, convergence is presumed. But PAGES2K algorithm did NOT converge for paki033. It was stopped at iteration 21. I ran D’s algorithm for 100 iterations and found that the Melvin “test statistic” (a weird one) increased up to iter ~68, dropped suddenly, then rose
this is NOT acceptable behaviour in a valid algorithm purporting to converge
what was happening to the chronology during these wild changes in “convergence” statistic? The blade (which had stopped at ~4) continued to grow reaching ~37 at iteration 50, then declined to ~15.3 by iteration 100. Obviously not climatic
the maximum of the blade by iteration for 500 iterations is shown below. It did actually converge under Melvin statistic – but to an implausibly large blade of 15.338.
@detgodehab observed “so clearly convergence doesn’t mean that a chronology is valid”. Clearly.
recall the diagram shown previously in which I had extracted the smooth ‘model’ for an individual core. At right are the ‘models’ for each core at convergence: they all approach zero at end.
a technical point: there are two main approaches to “detrending” each core to allow for juvenile growth: 1) a separate curve for each tree/core; 2) one curve (typically negative exponential plus constant) for site.
I did an experiment applying Melvin’s iterative method and supsmu smoothing as follows: 1) to individual cores as done in PAGES2K Asia; 2) one curve for entire site (“RCS”). The monster blade only appeared with PAGES combination of Melvin iteration and supsmu corewise smoothing.
thus far, I’ve discussed one site paki033.
@detgodehab has verified that same flawed algorithm was used for at least 8 other Pakistan sites. Note that these sites (together with Columbia U’s Mongolia chronologies) dominate PAGES19 list of heavy contributors to closing blade.
Also note that all these sites were preferential selected by the PAGES2019 screening procedures (which I’ve criticized elsewhere.)