

Gas giants of the solar system [image credit: Wikipedia]
Wavelet transforms reveal solar system footprints in climate time series, says Prof. Harald Yndestad. He explains how TSI (total solar irradiance) has a mean growth from 1700 to 2014. We believe the ideas here have links with this recent Talkshop post. (For the full technical discussion and wavelet examples see the linked article. Some extracts here.).
– – –
In the mid-1980s, the mathematician Yves Mayer from the University of Marseille and the petroleum engineer Jaean Morlet worked with the analysis of data from petroleum surveys at Elf-Aquitaine, writes
Harald Yndestad @ The Climate Clock.
In their efforts to find better methods for frequency analysis, they rediscovered a set of a new type of transformations which they called Wavelets.
The wavelet transform solved some of the weaknesses of the Fourier transform. It required less computing power; it was possible to identify period and phase relations in time-series, and non-stationary periodic variations in nature.
When the method was presented, Morlet received the comment, “A method, not described in any textbook, cannot be of great importance”.
In 1988, Ingrid Daubechies published the article “Orthogonal Bases of Compactly Supported Wavelets”. This is perhaps the most important contribution to frequency analysis of time series since Fourier published his book in 1822.
I started using wavelet spectrum analysis around the year 2000. The problem was to find coincidences between the cod recruitment and the temperature variations in the Barents Sea. There are, however, a variety of wavelet functions, which calculate results variations.
The best choice of wavelet function had to be adapted to the statistical properties from the time series. This led to my own investigations of all wavelet function in the MATLAB Toolbox.
When I submitted the manuscript for review, wavelets spectrum analysis was unknown to editor. To find a reviewer, I visited the EGU conference in Vienna. Here I found two young PhD students who studied the wavelet transform.
Gradually, more people began to use the wavelet transform to study climate time series. Still most scientists are using the wavelet transform as a substitute for Fourier analysis. To me this is a wrong use of this powerful method.
. . .
[Some technical discussion omitted here – see linked article].
. . .
Example 2: Total solar irradiation
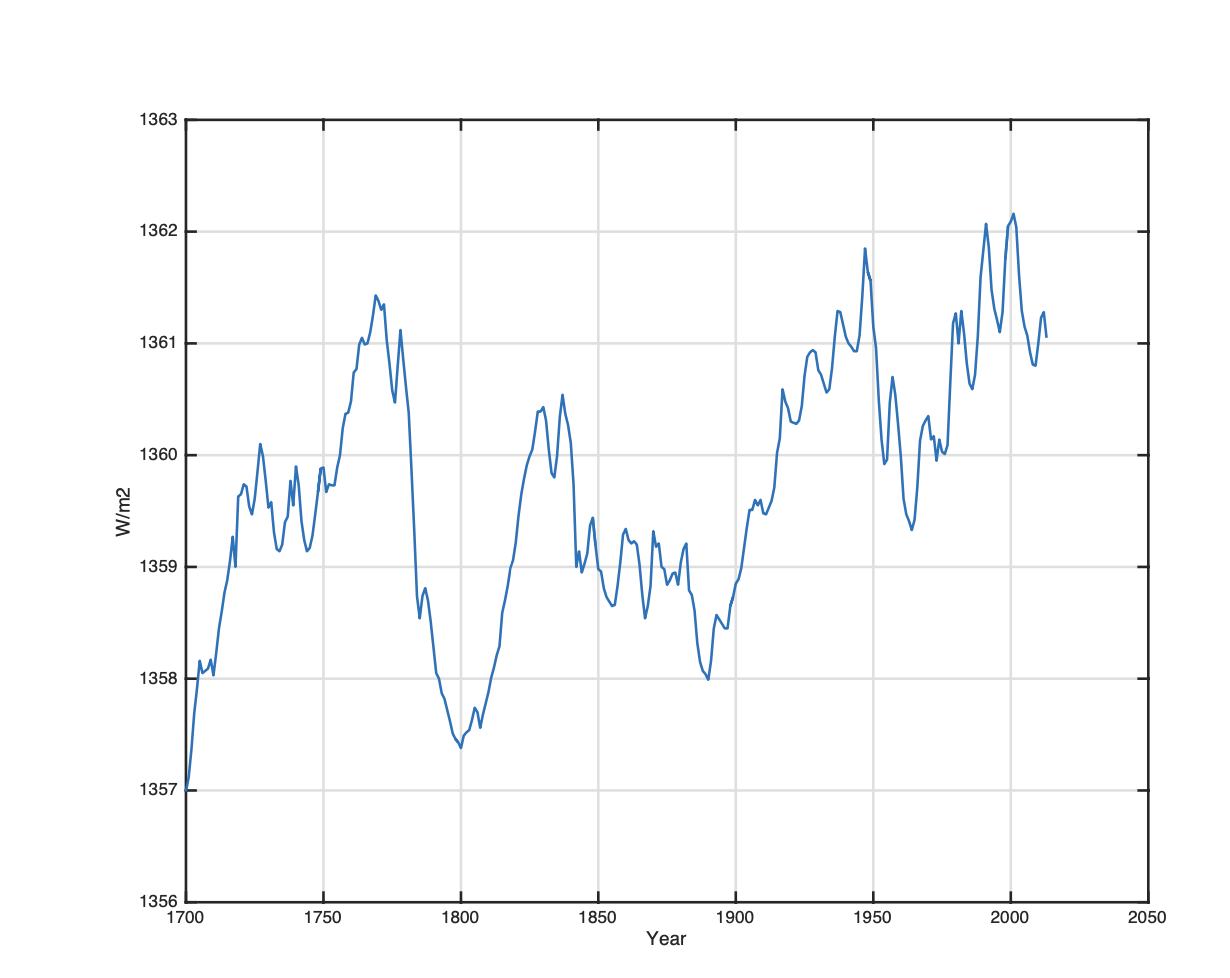
Figure 5: Total solar irradiance from A.D. 1700 to 2013 (Scafetta & Willson, 2014).
The Total solar irradiation (TSI) represents the measured irradiation Wm-2 at the average distance from the Sun to the Earth. Figure 5 shows an annual mean Total solar irradiance time series that covers the period from A.D. 1700 to 2013 (Scafetta & Willson, 2014).
A simple visual inspection of this data series shows that TSI from the sun has variations, and TSI has a mean growth from 1700 to 2014. The research question is to reveal the source of TSI variations.
. . .
The computed wavelet specter revealed, for the first time, that the Jovian planets are the source of TSI variations. The result was confirmed by a wavelet spectrum analysis of the sun’s movement around the solar system Barycenter.
A study of Jovian planet movements has revealed a direct relations between Jovian planet movement, solar positions movement and TSI variations in periods up to 4450 years (Yndestad 2022).
Full article here.
– – –
[Talkshop note: 3 dots indicate an omission from the original article.]
via Tallbloke’s Talkshop
August 21, 2023 at 04:45PM
