It’s dangerous, *we must* do this that and the other, ambition, fight, requirements etc. When will the tedious climate ranting ever stop? Endless stats come and go, announcing the latest failures of policies supposedly intended to arrange global temperatures to some fraction of a degree. The more they complain, the faster total energy consumption rises, defeating all attempts at control by (as Bill Gates put it) ‘jerking around with renewables’. – – – The world is falling dangerously short of the ambition that is needed to secure a safe future climate, according to new analysis by PwC, and as a result we need to fight to prevent every fraction of a degree of warming. [Talkshop comment – fight with what?]
PwC’s latest Net Zero Economy Index shows that a year-on-year decarbonisation rate of 17.2% (up from 15.2% last year) is now required to limit global warming to 1.5°C above pre-industrial levels – seven times greater than what was achieved over the last year (2.5%) and 12 times faster than the global average (1.4%) over the past two decades.
To put this into perspective, since 2000, no G20 country has achieved a decarbonisation rate of more than 11% in a single year – the highest level was achieved by the UK in 2014 (-10.9%).
The Index provides a stark illustration of the growing divergence between the global ambition to tackle climate change and the reality of current progress.
Our analysis shows that all nations need to work harder to reduce emissions to stand any chance of meeting the IPCC’s 2030 deadline to reduce emissions by 43%, with a 78% reduction in carbon intensity now required in under seven years.
Emma Cox, Global Climate Leader, at PwC said:
“The fact the world needs to decarbonise seven times faster is a spur to action, not a counsel of despair. While the overall pace has to pick up rapidly, dramatic change is possible when business and policy makers align. The rapid acceleration of the deployment of wind and solar in several regions shows change can happen. The world is decoupling growth from carbon emissions, now we need that trend to become a surge.”
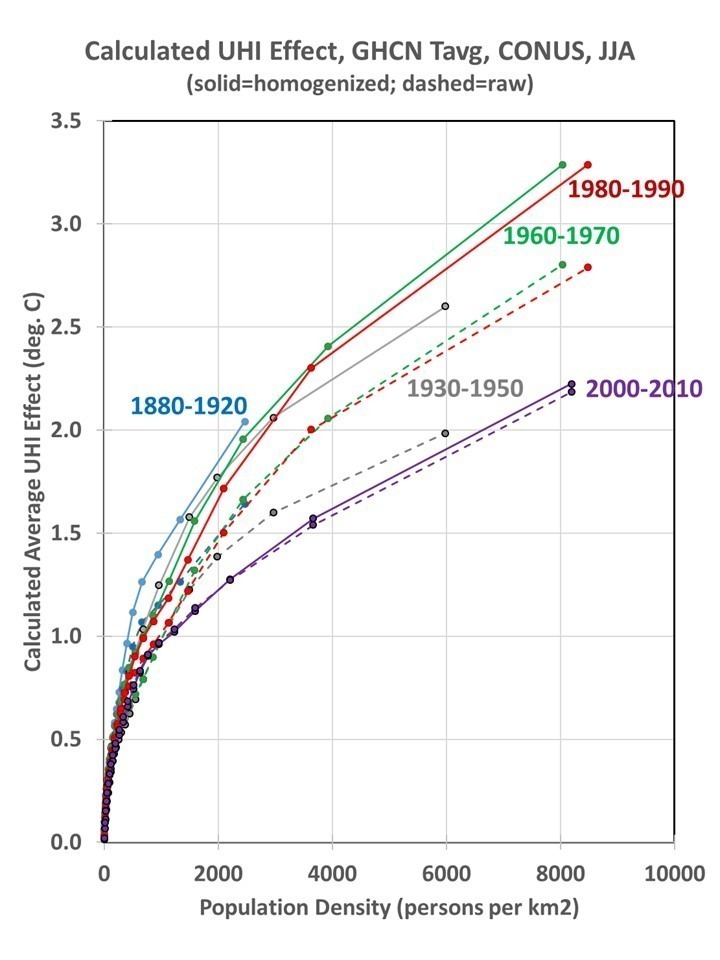
We are now getting close to finalizing our methodology for computing the urban heat island (UHI) effect as a function of population density, and will be submitting our first paper for publication in the next few weeks. I’ve settled on using the CONUS (Lower 48) U.S. region as a demonstration since that is where the most dense network of weather stations is. We are using NOAA’s V4 of the GHCN monthly dataset.
I’ve previously described the methodology, where I use many thousands of closely-spaced station pairs to compute how temperature between stations change with population density at 10×10 km resolution. This is done for 22 classes of 2-station average population density, and the resulting cumulative UHI curves are shown in Fig. 1.
Fig. 1. Cumulative urban heat island effect in different multidecadal periods for the contiguous U.S. (CONUS), June/July/August, for GHCN monthly average ([Tmax+Tmin/2]) temperatures calculated from regression of station-pair differences in temperature vs. population density in 22 classes of 2-station average population density. The number of station pairs used to compute these relationships ranges from 210,000 during 1880-1920 to 480,000 during 2000-2010.
It is interesting that the spatial (inter-station temperature difference) UHI effect is always stronger in the homogenized GHCN data than in the raw version of those data in Fig. 1. The very fact that there is a strong urban warming signal in the homogenized data necessitates that there must be a UHI impact on trends in those data. This is because the urban stations have grown substantially in the last 130 years. A recent paper by Katata et al. demonstrates that the homogenization technique used by NOAA does not actually correct urban station trends to look like rural station trends. It does breakpoint analysis which ends up adjusting some stations to look like their neighbors, whether urban or rural. To the extend that spurious warming from UHI is gradual through time, it “looks like” global warming and will not be removed through NOAA’s homogenization procedure. And since all classes of station (rural to urban) have undergone average population growth in the last 130 years, one cannot even assume that rural temperature trends are unaffected by UHI (see Fig. 2).
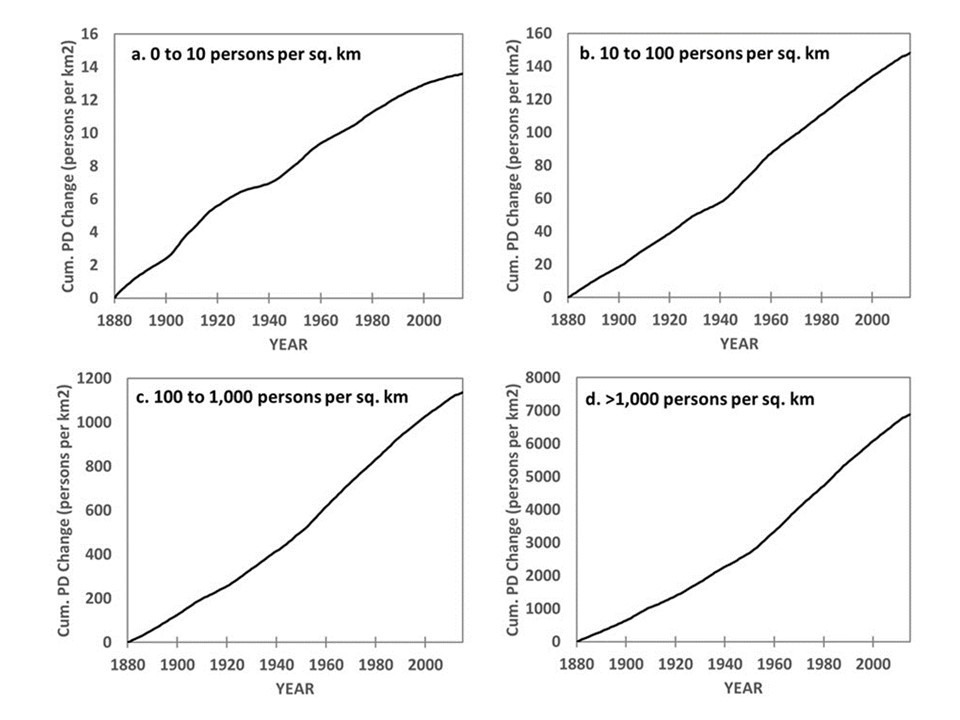
Fig. 2. Cumulative growth in population density (PD) 1880-2015 at temperature monitoring stations in four classes of initial station urbanization, calculated by summing the average year-on-year increases in HYDE3.2 dataset population density at individual GHCN stations having at least two years of record in the 20°N to 80°N latitude band, for initial station PD of a 0 to 10, b 10 to 100, c 100 to 1,000, and d greater than 1,000 persons per sq. km initial station population density.
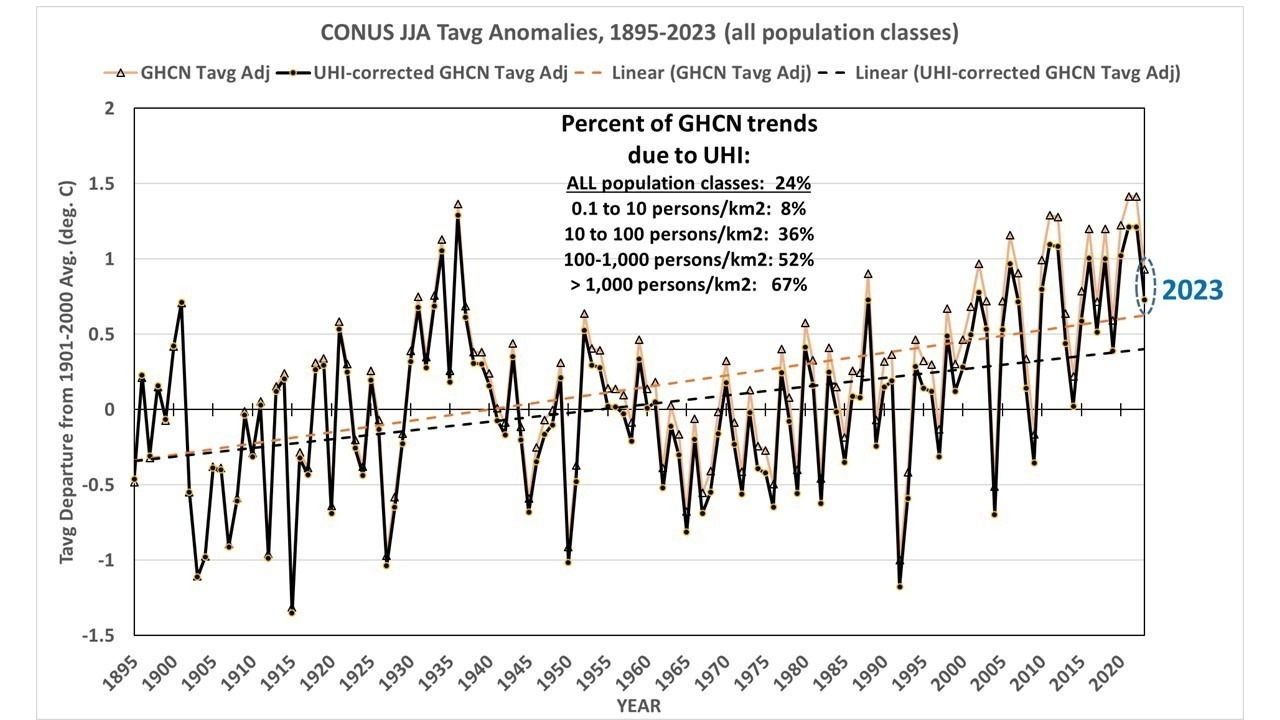
The regression estimates of change in temperature with population density (dT/dPD) used to construct the curves in Fig. 1 were used at each individual station in the U.S. and applied to the history of population density between 1895 and 2023. This produces a UHI estimate for each station over time. If I compute the area-average GHCN yearly summertime temperature anomalies and subtract out the UHI effect, I get a UHI-corrected estimate of how temperatures have changed without the UHI effect (Fig. 3).
Fig. 3. Lower-48 (CONUS) summertime U.S. temperature variations, 1895-2023, computed from GHCN “adj” (homogenized) data, versus those data adjusted for the urban heat island warming estimated from population density data.
The data in Fig. 3 are from my 1 deg latitude/longitude binning of station data, and then area-averaged. This method of area averaging for CONUS produces results extremely close to those produced at the NCDC “Climate at a Glance” website (correlation = 0.996), which uses a high resolution (5 km) grid averaged to the 344 U.S. climate divisions then averaged to the 48 states then area averaged to provide a CONUS estimate.
UHI Warming at Suburban/Urban Stations is Large
The UHI influence averaged across all stations is modest: 24% of the trend, 1895-2023. This is because the U.S. thermometer network used in Version 4 of GHCN is dominated by rural stations.
But for the average “suburban” (100-1,000 persons per sq. km) station, UHI is 52% of the calculated temperature trend, and 67% of the urban station trend (>1,000 persons per sq. km). This means warming has been exaggerated by at least a factor of 2 (100%).
This also means that media reports of record high temperatures in cities must be considered suspect, since essentially all those cities have grown substantially over the last 100+ years, and so has their urban heat island.
“It was raining intensely. Around 4am I heard a deafening crash. Just behind the house, the entire hill collapsed and unleashed a torrent of water and mud that destroyed everything. I survived, but my daughter, wife and my mother died in their sleep,” Prakash said.
…
“Due to global warming, the monsoon winds now carry more moisture from the sea along with dust and pollution from the plains. Himachal’s bowl-like topography captures those moisture-laden clouds. This leads to excess monsoon rainfall in less periods. The result is flooding,” Shukla explained.
…
Stopping the flow of rivers by dams in Himachal Pradesh has led to severe riverine disturbances, said Manshi Asher, co-founder of the environmental group Himdhara.
“When the water increases beyond the holding capacity of the dam, they open the floodgates without warning. The impact is visible in the form of landslides and floods,” she said.
The lack of comprehensive data on the environment in the region has also made the situation more dangerous.
I wonder what the original draft of that Al Jazeera story looked like?
In my opinion, someone involved in the chain of publication of that Al Jazeera story appears to have tried to tell the real story – uncontrolled building of dams, poor management of said dams, including abrupt releases of water without warning, and a lack of environmental data, have dramatically worsened the risk of landslides and floods.
But Al Jazeera decided to lead with climate change claims, which given the “lack of comprehensive data”, do not seem to be backed by solid evidence.
Even if CO2 is increasing rainfall, would reducing emissions fix the “landslides and floods” caused by poor water management? Or would focussing on water management issues be more likely to lead to an improved near term outcome?
If Al Jazeera had led with the dam management issue, I would have praised their handling of the story, even if it contained alarmist climate content. But instead of telling the story, in my opinion Al Jazeera have done a grave disservice to Om Prakash and others in his situation, by using Prakash’s tragedy as a prop to push their political climate agenda. You have to read the full article to read about the real root cause of local landslide and flood tragedies.