
A stable current global sea level record has apparently been “corrected” to show accelerated rise since the 1990s.
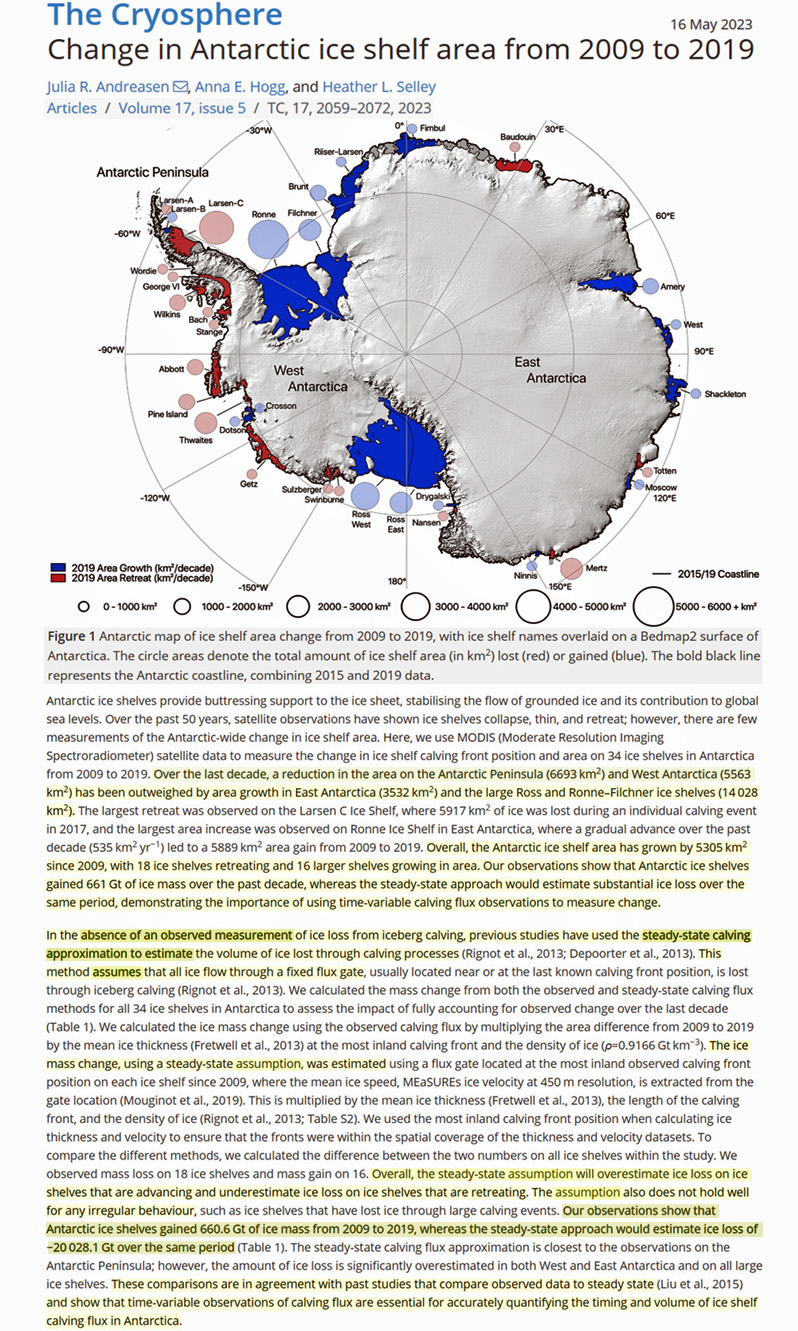
A few months ago we highlighted a new study indicating satellite observations reveal Antarctic-wide ice shelves gained +661 Gt of mass from 2009 to 2019.
Instead of reporting on these actual observations, agenda-driven scientists have long been using an approach relying on assumptions of an unrealistic “steady state” or fixed calving flux (instead of real-world time-variable observations). An assumption-based assessment approach allows estimates a net Antarctic ice shelf change to go from a +661 Gt mass gain to a -20,028 Gt mass loss over this 11-year period (Andreasen et al., 2023).
This is a more than 30-fold distortion of what actual observations indicate.
“Correcting” stable sea levels to show accelerated rise
A few years ago Australian scientists exposed a similar assumption-based assessment approach in estimating trends in global sea level change.
According to long-term global tide gauge data (from the 100 tide gauges with more than 80 years of continuous data), sea levels have been gradually rising at rates of about +0.25 mm/year with no perceptible acceleration since the early 20th century.
Likewise, when satellite altimeters were originally deployed in the 1990s to early 2000s they consistently did “not show any sea level rise.”
A lack of sea level rise didn’t advance the narrative, of course.
So instead of reporting on what the actual satellite observations showed, arbitrary, subjective assumptions were employed to “correct” the data to show sea levels have been rising at rates of 3.2 mm/year instead.
The GMSL satellite altimeter data showed no rising trend for the first 5 years of the record. The first 5 years were then “corrected” to show +2.3 mm/year of sea level rise.
The GRACE satellite data showed the was a -0.12 mm/yr sea level fall trend from 2003 to 2008. After “correction,” this was changed to a +1.9 mm/year sea level rising trend.
“…the untampered results, not showing the desired sea level rise, were replaced by ‘corrected’ results. [U]ntil August 4, 2011 the European Space Agency’s Envisat satellite was showing less than +0.976 mm/year sea level rise since 2004. A few months later, thanks entirely to further corrections, the same data set showed +2.97 mm/year of sea level rise.”
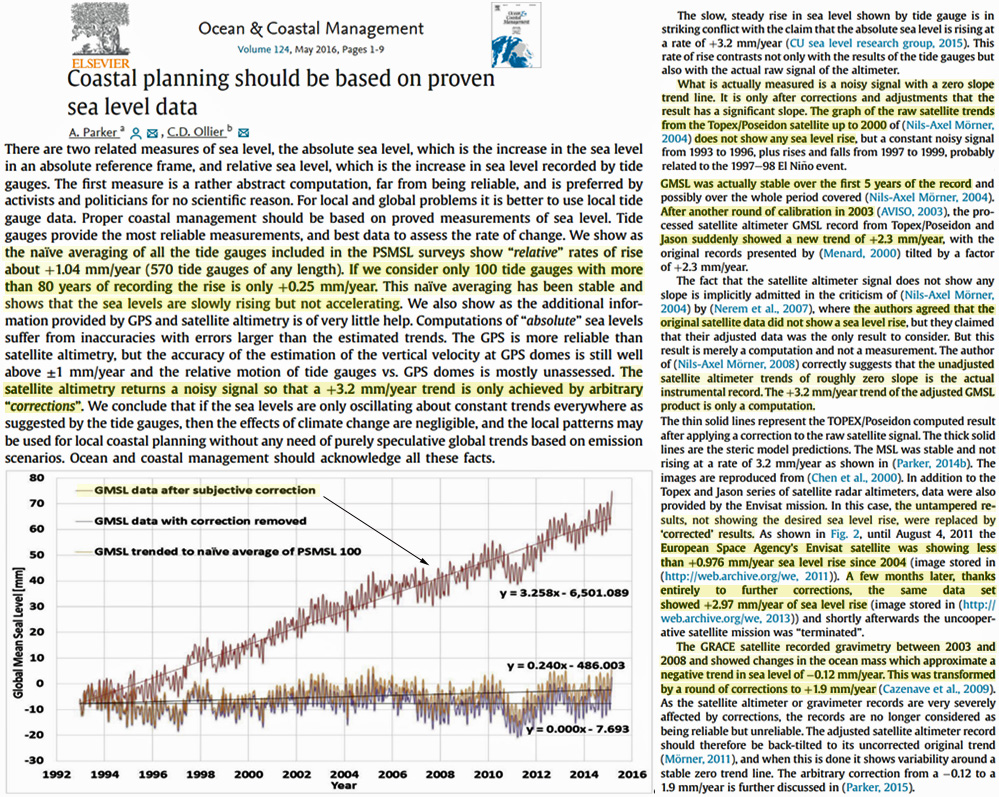
Image Source: Parker and Ollier, 2016
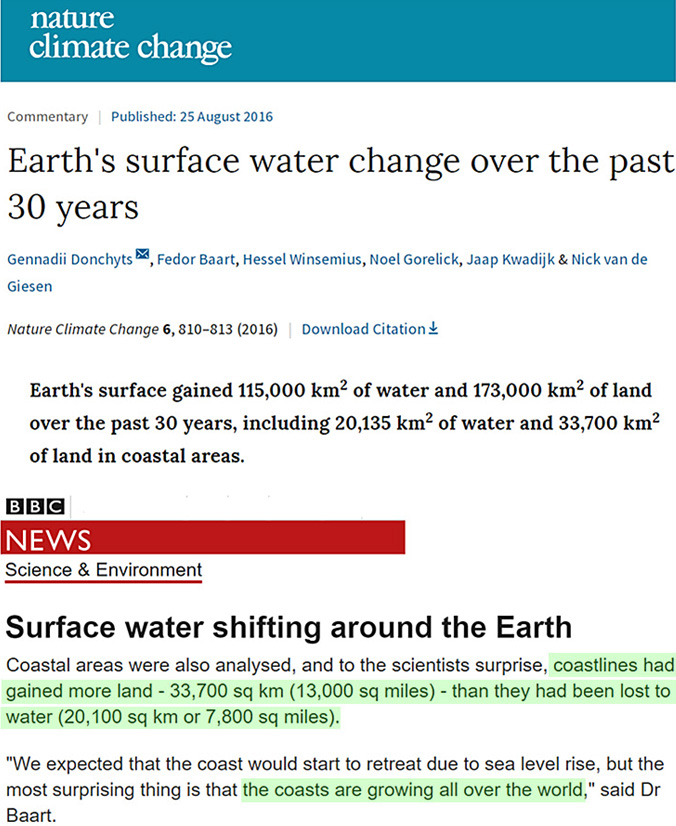
Satellite data reveal coastal land area has been expanding seaward since 1984
A 2021 study (Mao et al., 2021) lends support to what the untampered satellite altimetry data indicated − prior to the assumption-based corrections.
Today there are high resolution satellite images available from Google Earth clearly demarcating global-scale decadal shoreline change since the 1980s. And, despite the “accelerating sea level rise” claims, the 1984-2019 satellite data show coastlines have been expanding by a net +0.26 m/year.
According to Mao and colleagues, Australia’s coasts have been growing at a rate of +0.10 m/year since 1984. Asia’s coasts have been expanding +0.64 m/year. Europe’s coasts are accreting +0.45 m/year. And the African continent has been observed expanding at a +0.31 m/year clip.
The only two continents where coasts have not been observed expanding in recent decades are South America, 0.00 m/year, and North America, -0.29 m/year.
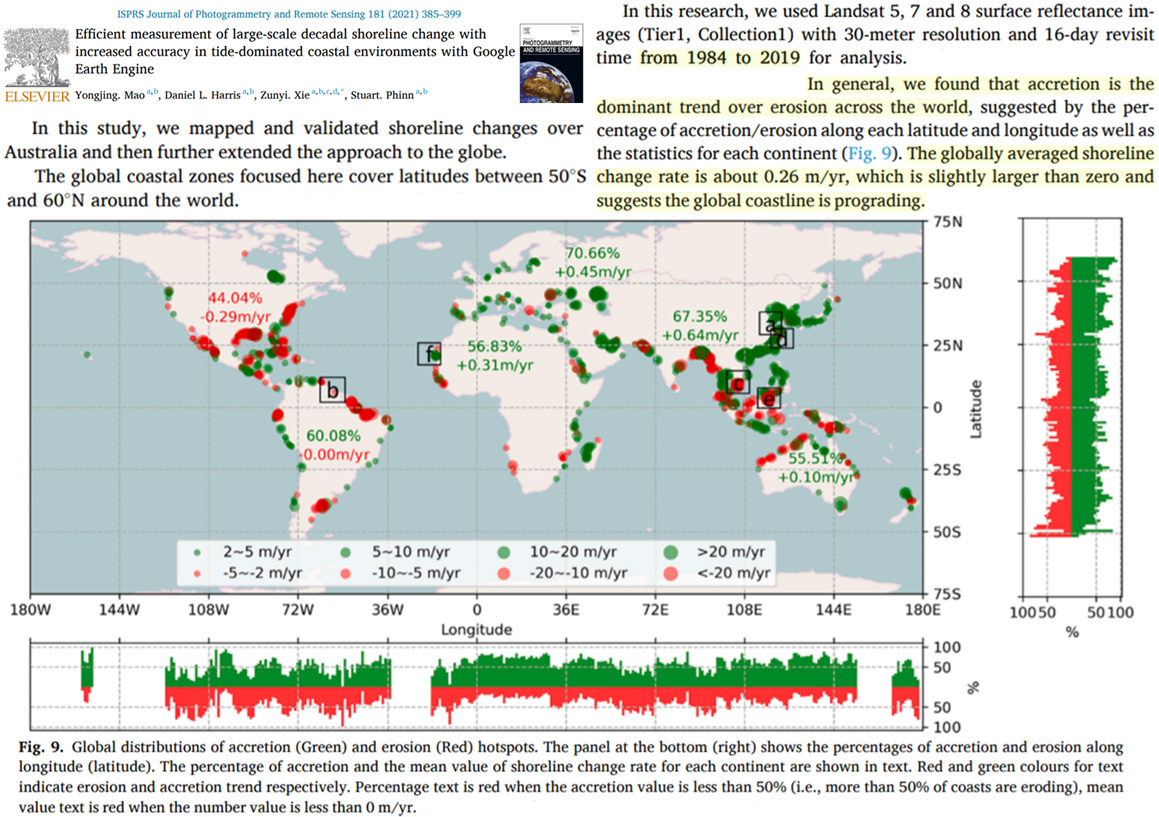
Image Source: Mao et al., 2021
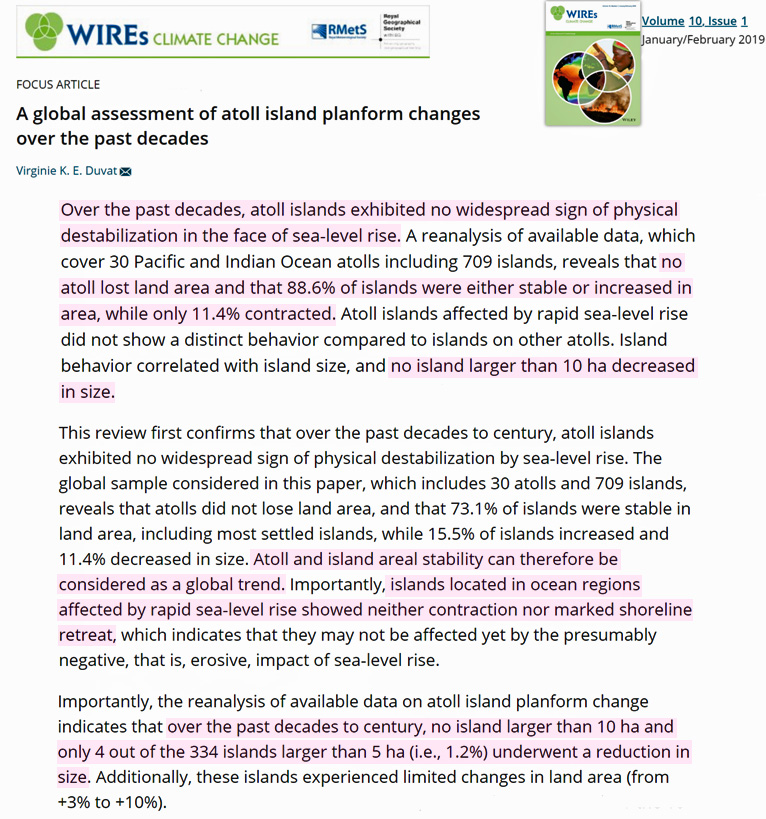
A 2019 global-scale analysis of 709 islands in the Pacific and Indian Oceans revealed 89% were either stable or growing in size, and that no island larger than 10 ha (and only 1.2% of islands larger than 5 ha) had decreased in size since the 1980s (Duvat, 2019).
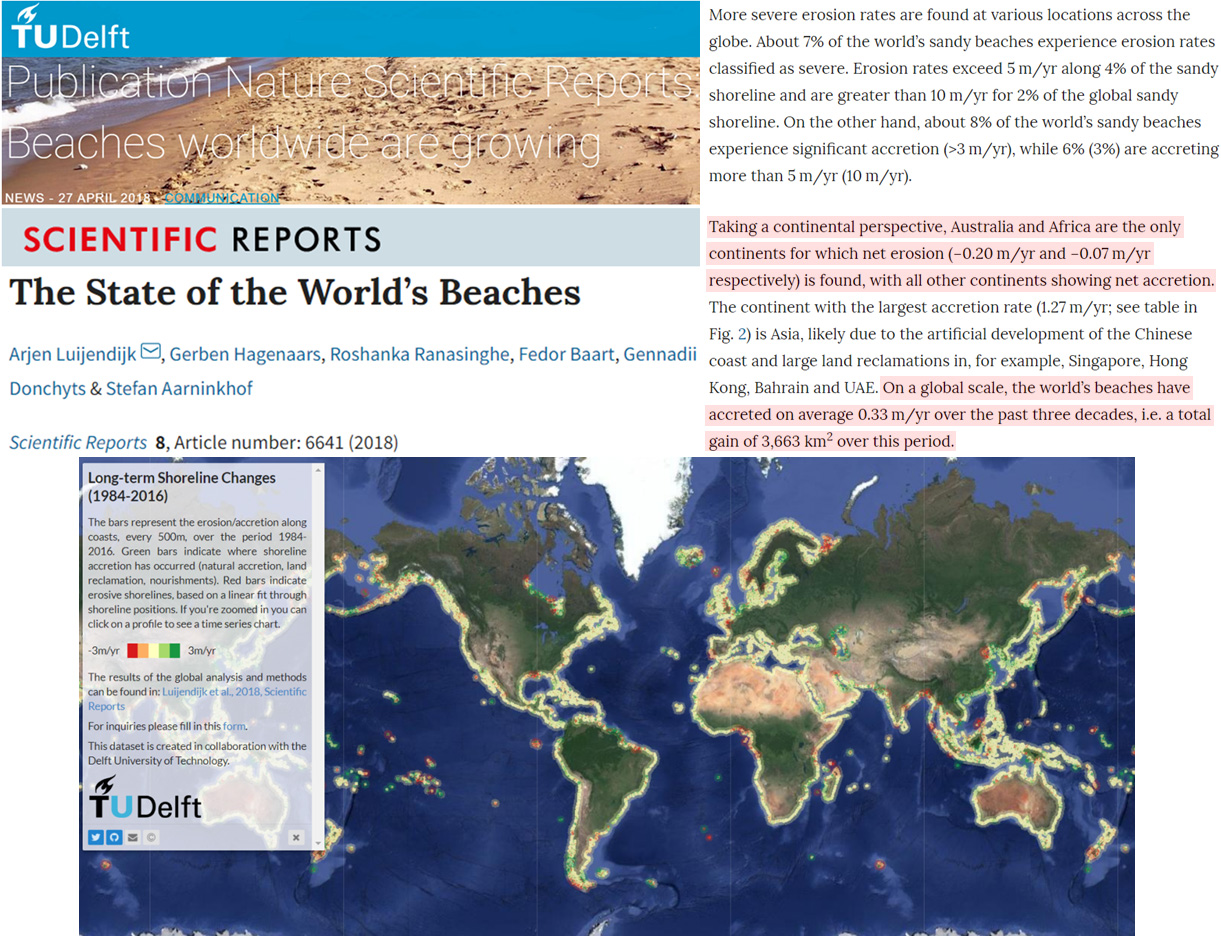
Likewise, the globe’s beaches been growing by 0.33 m/year since 1984 (Luijendijk et al., 2018).
In a press release for 2016 paper on coastal land area changes from 1985 to 2015, scientists acknowledged this:
“We expected that the coast would start to retreat due to sea level rise, but the most surprising thing is that the coasts are growing all over the world“ – BBC
Claims of dangerously accelerating sea level rise posing an imminent global threat to coasts in the satellite altimetry era may not just be inaccurate. They may be fake.
via NoTricksZone
September 14, 2023 at 11:35AM


