The Texas Permanent School Fund (PSF) is pulling $8.5 billion from the investment firm BlackRock over its use of environmental, social and governance (ESG) policies.
“The PSF’s relationship with Blackrock was not in compliance with Texas Government Code Section 809, commonly known as Senate Bill 13, which prohibits state investment in companies like Blackrock that boycott energy companies,” Texas State Board of Education Chairman Aaron Kinsey said in a Tuesday statement.
“BlackRock is helping millions of Texans invest and save for retirement,” a BlackRock spokesperson told the DCNF. “On behalf of our clients, we’ve invested more than $300 billion in Texas-based companies, infrastructure and municipalities, including $125 billion invested in the energy sector, including $550 million a joint venture with Occidental. We recently hosted an energy summit in Houston designed to explore how to strengthen Texas’ power grid.”
BlackRock has been accused of leveraging its investment in companies to push ESG issues, which push companies to prioritize social and environmental factors into their investment considerations instead of “simply considering the potential profitability,” according to Investopedia.
“Under Larry Fink’s leadership, BlackRock has been misusing client funds to push a political agenda for years. Nowhere was that more egregious than in Texas, where BlackRock was simultaneously trying to destroy the domestic oil and gas industry while managing funds that depended on royalties derived from that very same industry,” Hild commented in a post on X. “A more flagrant violation of fiduciary duty is difficult to imagine.”
“By divesting $8 billion from BlackRock, Chairman Kinsey and the Permant School Fund are not only fulfilling their role as fiduciaries to one of the largest education funds in the country but sending a clear message to Wall Street elites that people can no longer be bullied into complying with ESG’s destructive ideology,” Hild continued. “I look forward to seeing many more states follow suit.”
BlackRock saw almost $4.5 billion pulled from the company over its use of ESG in 2022. Republican Attorney General Jonathan Skrmetti of Tennessee sued Blackrock in December, accusing the company of depriving consumers of “the ability to make an informed choice” about the potential impacts using ESG factors for investment.
All content created by the Daily Caller News Foundation, an independent and nonpartisan newswire service, is available without charge to any legitimate news publisher that can provide a large audience. All republished articles must include our logo, our reporter’s byline and their DCNF affiliation. For any questions about our guidelines or partnering with us, please contact licensing@dailycallernewsfoundation.org.
The allure of the Arctic continues to captivate imaginations with its beautiful, if sometimes forbidding, wilderness. Equally captivating to some, beneath these vast landscapes of permafrost and ice, is the economic lure of oil and gas promising economic prosperity and development. However, for the Inuit communities in Canada, Alaska and Greenland, who call this region home, securing the benefits of these resources has not been straightforward.
It has long been a popular assumption that the Inuit universally oppose oil and gas projects. However, this an inaccurate perception fed by a media that oversimplifies complex subjects and portrays dissenting voices as widely accepted viewpoints. Although preferences vary, many Inuit communities have long favored development of the region’s hydrocarbons.
Importance of Oil and Gas for Alaskan Inuit
In 2018, in the town of Utqiagvik, Alaska, the head of one of reportedly the world’s richest indigenous organization, explained the importance of oil and gas development to the region: “You see, our region is dependent upon the economy that oil and gas development brings, said Rex Rock, CEO of Arctic Slope Regional Corp.
Not only are houses in Utqiagvik powered by natural gas, the oil economy funds the city’s municipal expenses and provides the livelihoods of citizens.
This is why the Inupiat people of the North Slope, located at the northern boundary of Alaska, consistently back the region’s oil projects and, given Washington, D.C.’s hostility toward fossil fuels, have been calling for an amplified role in decision-making.
Writing in support of the North Slope’s long-delayed Willow project in a WSJ article, Inuit political leaders said, “We still live in homes that aren’t connected to running water and basic sewage systems. We have no roads connecting our communities because the federal government won’t allow us to build them. … We are tired of outside groups trying to turn this project and every other oil and gas project in our region into the poster child for a global movement away from fossil fuels.”
The Willow project is now underway, thanks to a November 2023 court ruling. The first oil is expected in 2024. The project is estimated to generate between $8 billion and $17 billion in new revenue for federal, state and local governments, including Utqiaġvik’s.
Inuits Struggle Against Canadian Government’s Arctic Moratorium
The situation is even more challenging in the Canadian Arctic. In 2016, the Canadian federal government issued a moratorium on oil and gas activities in the region. Broadcaster CBC News says political leaders in Canada’s northern provinces, including leaders of indigenous communities, “have been pushing for those restrictions to be lifted, arguing that the North needs the economic development that would come with offshore exploration and licensing.”
In August 2023, considering the requests of Inuits and Northern Provinces, the Canadian government signed a historic deal called the “Western Arctic – Tariuq Accord” with the Inuit government. Dubbed as a “first of its kind,” the deal is believed to have opened doors to increased participation of local Inuit communities in the decision-making process for oil and gas projects, paving way for the drilling to resume in this region.
According to reports of the Canadian government, the Inuit, including Métis and First Nations people, “have experienced significant disparities in the job market” and have “lower educational attainment, insufficient training, … limited access to postsecondary education, lack of affordable housing, lack of childcare.”
Is it any wonder that indigenous Canadian leaders want oil and gas projects? Apart from direct revenue sharing, likely benefits would include improved access to healthcare, education and emergency services and construction of roads, ports, and telecommunications networks. These in turn will create employment opportunities, eventually reducing socio-economic disadvantages of the Inuit.
Without a doubt, some Inuit have reservations about these projects, and their concerns will play a significant role in the collaborative decision-making process. Ultimately, the goal should be to achieve a mutually beneficial scenario, where Inuit communities desiring these economic initiatives can pursue them. Sweeping prohibitions on Arctic drilling lacks economic logic for communities favoring it.
Vijay Jayaraj is a Research Associate at the CO2 Coalition, Arlington, Virginia. He holds a master’s degree in environmental sciences from the University of East Anglia, U.K.
This commentary was first published at Real Clear Energy on March 18, 2024.
Vijay Jayaraj is a Research Associate at the CO2 Coalition, Arlington, Virginia. He holds a master’s degree in environmental sciences from the University of East Anglia, U.K.
The radiative effect of natural wildfire aerosol forcing alone can be said to fully cancel out the total accumulated forcing from 170 years of CO2 increases in the current climate.
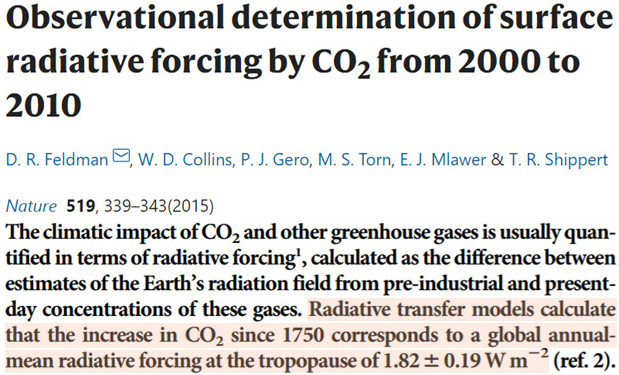
It has been estimated that the total change in climate forcing (radiation imbalance) from the 1750 to present CO2 concentration increase has been 1.82 W/m².
New research suggests today’s climate models omit an “important perturbation to Earth’s energy balance” because they fail to include the natural climate forcing potential from aerosols produced by wildfires and dust loading.
Climate models expressly assume this non-volcanic natural aerosol forcing is not present, or 0.0 W/m², even though it has been estimated that aerosol forcing from wildfire emissions alone – which were much higher during the preindustrial period before declining to today’s levels – deliver a “radiative effect in the current climate of -2 W/m².” Therefore, this natural climate forcing effect can be said to, by itself, fully cancel the surface forcing from the post-industrial CO2 increases.
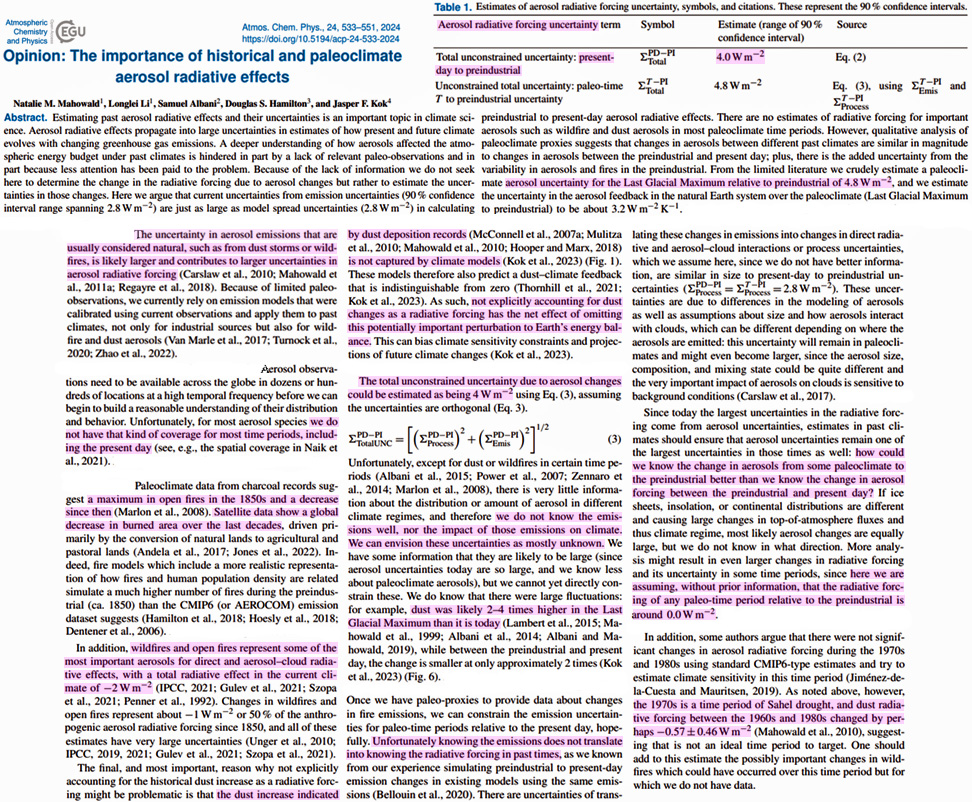
Furthermore, the estimated 4 W/m² uncertainty in preindustrial-to-present (1850-) aerosol climate forcing from natural wildfire emissions and dust is also over two times larger than 270 years of CO2 concentration increases (1.82 W/m² since 1750). This effectively means that anthropogenic CO2 forcing is too uncertain to clearly separate from natural aerosol forcing.
1) Regarding the natural aerosol forcing uncertainty missing in the models…
“The uncertainty in aerosol emissions that are usually considered natural, such as from dust storms or wildfires, is likely larger and contributes to larger uncertainties in aerosol radiative forcing.”
“There are no estimates of radiative forcing for important aerosols such as wildfire and dust aerosols in most paleoclimate time periods.”
“…dust deposition records [are] not captured in climate models. These models therefore also predict a dust-climate feedback that is indistinguishable from zero. As such, not explicitly accounting for dust changes as a radiative forcing has the net effect of omitting this potentially important perturbation to Earth’s energy balance.”
“…here we are assuming, without prior information, that the radiative forcing of any paleo-time period relative to the preindustrial is around 0.0 W/m².”
“…we do not know the emissions [from wildfires or dust] well, nor the impact of those emissions on climate. We can envision these uncertainties as mostly unknown.”
2) Regarding the larger radiative forcing impact and uncertainty values of natural aerosols than CO2 forcing…
“In addition, wildfires and open fires represent some of the most important aerosols for direct and aerosol-cloud radiative effects, with a total radiative effect in the current climate of -2 W/m².”
“The total unconstrained uncertainty due to aerosol changes [since 1850] could be estimated as being 4 W/m².”
“…dust [radiative forcing] was likely 2-4 times higher in the Last Glacial Maximum [~25,000 to 17,000 years ago] than it is today.”
“From the limited literature we crudely estimate a paleoclimate aerosol uncertainty for the Last Glacial Maximum relative to preindustrial [1850] of 4.8 W/m².”
“Paleoclimate data from charcoal records suggest a maximum in open fires in the 1850s and a decrease since then. Satellite data show a global decrease in burned area over the last decades…”
“…the 1970s is a time period of Sahel drought, and dust radiative forcing between the 1960s and 1980s changed by perhaps -0.57 ±0.46 W/m².”
We have now entered the 4th decade of measuring sea level rise using the quartet of satellites Topex and Jason 1, 2 and 3. The first 3 decades were reported in the trio of papers (Ref 1), (Ref 2) and (Ref 3). These concluded that.
1. The perceived “accelerations” are mathematical accelerations occurring due to the methods of calculation, i.e. quadratic curve fitting, as used by Nerem et al [.pdf] (Ref 4) in their 2018 paper. Also, the start date of Jan 1993 also plays a major role in how the “accelerations” pan out.
2. The “accelerations” are now generally reducing year on year and are predicted to reach levels compatible with the long term (over 100 years) Tidal Gauge values during the next decade or two before stabilising over the next few decades.
3. A time span of 30 years is much too short a period to calculate actual accelerations with 3 or more times this period being needed.
In this paper “accelerations” is used to indicate that those values are mathematically produced using twice the quadratic coefficient. Having said that the trends in values since about 2012 have settled sufficiently to make actual judgements regarding long term variation and trends.
The data for year 2023 will now be analysed with emphasis on 2 aspects, namely the predicted sizeable El Niño and the shenanigans concerning the data for October and November when nearly every data value changed with some changes being quite significant at over 8mm compared with annual increases of 3 to 4 mm.
Data releases via the NASA Global Climate Change/Vital-Signs/Sea Level Rise web site were made during 2023 for January, February, April, June, October, November and December but although all were analysed, not all will be reported on. Since February 2018 the analysis of the data has taken place in a standard manner every time a new set of data has been released. Extra processing has been also done when deemed of interest. In January 2023 the NASA site added an extra column (column 13) to the data which was as column 12 but with the GIA not applied [see column definitions just below]. The diagrams appearing on the NASA website showing sea level rises also changed at this stage in using column 13 instead of column 12. The inclusion of GIA or not only affects the rate of change and not any “acceleration” as it is set to a constant change of about 0.24 mm/year. In all the analyses for this paper and previous papers column 12 results have been used.
The full definitions of these 2 columns are,
Column 12 smoothed (60-day Gaussian type filter) GMSL (GIA applied) variation (mm); annual and semi-annual signal removed.
Column 13 smoothed (60-day Gaussian type filter) GMSL (GIA not applied) variation (mm); annual and semi-annual signal removed.
At this stage I would like to thank Kip Hansen for his patience in reading and replying to my steady stream of emails and whose comments have helped me formulate my ideas. Kip has not agreed with all my findings and ideas, but a friendly rapport has taken place between us.
Starting with the February data the “accelerations” have been calculated for increasing periods spanning the time from January 1993 up to the time of calculation. The results are shown in Figures 1 and 2.
Figure 1 compares the “acceleration” trend with that obtained from assuming the sea levels deviate from a straight line in a sinusoidal manner with a period of 26 years, an amplitude of +/-4.2 mm and with a suitable phase shift. The resulting graph of “accelerations” is labelled “Sinusoidal” on Figure 1. This curve is not a sinusoidal curve but a portion of a “damped” sinusoidal curve the derivation of which is shown in the Appendix to paper 1 (Ref 1). Its long-term variation is shown in Figure 3 together with average Tidal Gauge value. In this the sinusoidal curve is converging on zero but in reality, there could be a small long-term value commensurate with the Tidal Gauge value.
At this stage it had been stated that there may be a significant El Niño starting. Figure 4 below shows a plot of the El Niño Index. This is a more recent plot at the end of 2023, but the February 2023 data coincide with just about when the Index was zero but increasing.
It was decided to try to simulate the effect of an El Niño by taking the February 2023 data, which was available in May 2023, and extending the linear trend by about 5 years. Over the first 2 years a strong El Niño effect was achieved by raising the increase in sea level by roughly an extra 10mm. Over the next year the sea level drops back to the linear trend line. The Simulated El Niño is shown in figure 5 together with the linear trend.
A note to the purists. Every month when a new month is analysed the slope of the linear fit varies slightly therefore any actual residual sea level (actual minus linear value) or sinusoidal variation is measured to a slightly modified linear line. As the slopes are generally in the range 3.2 to 3.5 mm/year this is considered acceptable as being within “engineering tolerance” and being a retired engineer, I can sleep at night with this situation.
The modified data were analysed, and “accelerations” determined. The results are shown in Figure 6. The effect of the El Niño is to increase the “acceleration” temporary by about .01mm/year2 over the next 12 months or so and then resume a downwards trend. Interestingly two previous El Niños in 2015/16 (strong) and 2018/19 (moderate) show up as wiggles on the blue curve. The associated reduction in “acceleration” since 2020 is also shown in Figure 7
The next set of data to be analysed is for June 2023 resulting in Figures 8 and 9 which indicate a small influence of the El Niño starting.
When the October data were analysed, it was clear that there had been a dramatic change in the data readings as shown in figure 10.
Figure 11 below shows the differences between the October 2023 data and the June 2023 data. Over the first 10 years there had been increases in the October data of up to over 8mm. For the next 13 years the values stayed roughly the same with a reduction of about 2 mm over the last 7 years. The kick up at the end is mainly due to the El Niño. The consequences of these changes were to reduce the slope by about 0.3 mm/year and increase the “acceleration” by about 0.008 mm/year2. As of now no explanation has been found as to why these changes occurred. The last time any changes had occurred was in August 2021 with those changes varying between -2.5 mm and 0.5 mm resulting in little change in slope and a reduction in “acceleration” of 0.004mm/year2.
The November and December data release were anticipated with some trepidation and then analysed. The changes from June 2023 to November 2023 were lower as shown in Figure 12 with a maximum change now being about 5mm. From June 2023 this resulted in a reduction in slope of about 0.2mm/year and a reduction in “acceleration” of about 0.003mm/year2.
At this stage it was decided to create a combined plot of the November data showing the NASA data and the curve produced by combining the linear line with the sinusoidal variation, Figure 13.
Figures 14 and 15 show the latest (December 2023) plots of “acceleration” and reduction in “acceleration” since the 2020 peak.
A final plot, Figure 16, shows a comparison of “accelerations” since Jan 2020 based on the February 2023 data with the added El Niño simulation and the December 2023 data. If the 2024 trend follows the simulation trends the “accelerations” will peak at about .085 mm/year2 in the late summer of 2024 and quickly start reducing at nearly 0.01mm/year2 until the next significant El Niño appears.
Who doesn’t like a prediction? I’ve put my head up over the wall but at 86, with no agenda, reputation, University role or job to keep it’s nice to have that freedom. Just have to keep taking the tablets to see it all come to fruition!!
One conclusion is that the “accelerations” as calculated are not the harbingers of Doom and Gloom that many Climate Scientists, the BBC and the Guardian Paper portray. These “accelerations” may just be mathematical quirks and not of any major physical significance, but it could be revealing to try to match them and predict future variation especially over the next 10 years or so.
I have facilitated the publication of this essay, the fourth of Dr. Welch’s contributions here. Dr. Welch and I have had a long-standing continuing conversation, over several years, about sea level rise [SLR] rates and the assertion by some, Nerem et al. and others, that sea level rise is accelerating (meaning for SLR, rising faster and faster). NASA/NOAA likewise call the change in the rate seen when the satellite-calculated SLR is tacked on to the global tide gauge record at the year 1996 ‘accelerating SLR”. As with all numerical data that can possibly be associated with Climate Change, there is and has been a lot of fiddling with the methods, calculations, and resulting numbers. Thus, with sea level data, for which the annual changes are small compared to the magnitude of the confounding factors, little if anything can be ascertained with any degree of scientific certainty.
Long-time readers will remember that I am not a fan of the SLR Acceleration topic – for reasons stated above.
Dr. Welch’s take on acceleration is as valid as any other out there.
Earth’s sea levels are rising – they will continue to rise for all the reasons they have risen for the last few hundred years. It is my opinion that they will continue to rise at the same rate – 2 or maybe even 3 mm per year – into the future. This slow steady rise can and will be a problem for highly developed low-lying areas. Building within 8 inches of the today’s sea level – mean high tide — is and was always exceptionally foolish.
My thanks to Dr. Alan Welch for his continuing efforts to keep a close eye on the topic which allows him to catch repeated alterations of the data sets being used.
Dr. Welch is a guest here, please treat him like you would a guest in your own home.