Scotland’s oil and gas industry is estimated to have lost tens of thousands of jobs more jobs than has been gained from renewables in the nation’s green revolution over a decade leading to grave disquiet over how the nation’s energy economy is being handled, the Herald on Sunday can reveal.
The oil and gas industry in Scotland has shed nearly 40% of its jobs amounting to 50,000 in Scotland over a decade, according to industry figures – while the number gained from low carbon enterprises has risen by just 2,500.
It has raised serious concerns over promises from the Scottish Government that the just transition from fossil fuel production to low carbon "means an opportunity to protect, build and create jobs".
The Scottish oil and gas jobs loss has come despite the UK Government pressing ahead with new licensing for fossil fuels projects.
Ministers have now been accused by unions of mismanaging Scotland’s energy sector and of having "no credible plan" for the future while the green jobs revolution is being described as "remaining a myth".
Well, every time I go to look at the climate models, I come away more confused. And today is no exception. I decided to take a look at the relationship between the change in forcing (downwelling radiation) and the change in temperature.
Forcing datasets are somewhat hard to come by, but the Computer Model Intercomparison Project 5 (CMIP5) forcings for the GISS-E2 model are here. The sum of all the forcings is shown in Figure 1, along with the CEEMD smooth of the data.
Figure 1. Forcings used in the CMIP5 runs by the GISS E2 model.
The big dips in the forcings are the theoretical changes in forcing due to volcanic eruptions.
Next, here is the average surface temperature output of six runs of the GISS E2 model using those forcings, available from the marvelous KNMI website here.
Figure 2. Average of surface temperature (“tas”) output from six CMIP5 GISS model runs.
Already, although the model does a decent job hindcasting the past global surface temperature, we have problems. The difficulty is, back here in the real world, the volcanoes have not had that large an effect on the surface temperature.
Figure 3. Average surface temperature of six CMIP5 GISS model runs compared to Berkeley Earth surface temperature.
Why the exaggeration of the volcano effects? Me, I say it is because as the eruptions cool the surface, the climate responds by the daily tropical cumulus field forming later in the day, and the tropical thunderstorms also forming later or not at all. This warms the surface, counteracting the effects of the eruptions. However, YMMV …
But none of that is what I started out to look at. I wanted to see if the CMIP5 modeled temperatures slavishly follow the forcings. Thirteen years ago, I showed that the temperature output of the CCSM3 climate model could be very closely emulated by a simple one-line formula, viz:
See the linked post for the description of what the formula means.
So I used that formula, to see how well I could emulate the temperature output using nothing but the forcing applied to the model. Here’s the result:
Figure 3. “Black box” emulation of the GISS-E2 model temperatures, calculated from the forcing alone.
So the situation is unchanged. An R^2 of 0.97 says the emulation is doing a most excellent job. In passing, it’s interesting that the volcanic action in the model averages is a bit larger than in the calculations from the forcing, just as happened with the model average compared to the real world.
In any case, to recap the bidding: The GISS-E2 climate model has 440,000+ lines of code. It has over two million gridcells representing the world, and it takes a whole day to do just one model run on a parallel-processing computer with 88 processors.
And after all that, it merely spits out a lagged and resized version of the input forcing.
Hmmm …
Now, in the formula used to emulate the model output, the variable “lambda” (λ) is the change in temperature resulting (in modelworld) from a 1 watt per square meter (W/m2) increase in forcing. This is a measure of the “transient climate response” (TCR), how the temperature responds in the short term to a change in forcing. It’s usually expressed as the amount of change from a doubling of CO2 (2xCO2).
And the doubling of CO2 is said by the IPCC to increase forcing by 3.7 W/m2. This would make the TCR have a value of 0.41 °C/Wm2 * 3.7 W/m2 per 2xCO2 = 1.5°C / 2xCO2.
What was shocking? Well, several things. First, according to the article, every different model uses a different value for the increase in forcing from a doubling of CO2. Remember above where I noted that the IPCC says forcing increases by 3.7 W/m2 from a doubling of CO2 (2xCO2)? Here’s what the models say:
Figure 4. Change in forcing from a doubling of CO2 as used by 31 different climate models.
Zowie! The models are all over the place, with values for 2xCO2 forcing ranging from 2.6 to almost 4 W/m2. And the range of the uncertainty on the median value (width of the notch in the sides of the box) doesn’t even include the canonical IPCC value of 3.7 W/m2 … how these jokers have the nerve to call climate science “settled” is a mystery. Not only do we not have agreement on the values of the ECS and the TCR, but we don’t even agree on how much the forcing changes when CO2 doubles! Who knew? I remember Steve McIntyre asking for an engineering-level derivation of the 3.7 W/m2 figure for 2xCO2, but I had no idea that the models disagreed so much on this central figure.
Then there was another surprise. It turns out that the ECS is not some fixed multiple of the TCR. Instead, the ECS of small values of TCR is a smaller multiple of the TCR than for large values of the TCR. Figure 5 shows that relationship.
Figure 5. Scatterplot, ECS values versus TCR values for 31 different climate models.
This relationship would mean that the GISS E2 model would have an ECS on the order of 2°C / 2xCO2 … but of course, that’s only if the 2xCO2 forcing is 3.7 W/m2, when in fact we have values from 2.6 to almost 4 W/m2.
To compound the problem, as you can see, the different models give widely different values for equilibrium climate sensitivity (ECS). They range from 1.8°C to 5.7°C for a doubling of CO2, more than a three-to-one variation.
Here’s the final impossibility. Despite the different models having wildly different equilibrium climate sensitivities and different transient climate responses and different forcing changes from doubling CO2 … somehow they all do a pretty good job of hindcasting the actual temperature record.
And if the models were actually “physics-based” as every modeler claims, this would not be possible. I call this “Dr. Kiehl’s Paradox”, since he noted it first, and I discuss this impossible result here.
Gotta love that settled science …
Look, the ECS is a central, vitally important number in mainstream climate science. The forcing change from doubling CO2 is another central, vitally important number in mainstream climate science. They’ve been studying the subject for a half-century, and both numbers still have an enormous uncertainty range.
And worse than that, the uncertainty of the ECS has gotten wider with more study, not narrower …
Figure 6. ECS estimates over time, from 172 different sources.
In any other science, a half-century spent studying such a central number would result in reduced uncertainty … but in climate science, it’s going the other way.
To me, this is evidence that the basic paradigm of climate science is wrong. This basic paradigm is the claim that the temperature change is a linear function of the forcing change. I don’t think that’s true. I think that’s simplistic nonsense. I think that the climate actively responds to changing conditions and that there are a host of emergent climate phenomena that oppose any warming from any source, including changes in forcing.
Anyhow, that’s the story of my latest wandering through the models … I ended up knowing less than when I started.
Here in the US, it’s Mother’s Day, so my gorgeous ex-fiancee and I are going for a bike ride and then out for dinner … what’s not to like?
Best to all, and remember, when you comment please quote the exact words you’re discussing. It makes everything much clearer.
2024 Atlantic Hurricane Season – will be very active
with 20 Named Storms and 6 landfall Hot-Spots.
Tampa-Ocala, Florida, United States, February 1, 2024 /EINPresswire.com/ —
The Atlantic Hurricane Seasons have been extremely active since 2016 – and will continue to be abnormally active for the next several years. This is not due to a global warming cycle – but instead– it is due to the naturally occurring Atlantic Multi-decadal Oscillation (AMO) that enhances a cyclical ClimatePulse Cycle.
During the current AMO warm ocean cycle (warmest portion in 2016), the United States has experienced 40 named storms making landfall, with 20 of them being hurricanes – 9 of which were major hurricane landfalls. This very active hurricane cycle – will likely continue for another 10 years.
What Should We Expect in 2024
An average hurricane season has 12-13 named storms and 6 hurricanes. The combination of the AMO warm ocean water cycle, favorable atmospheric conditions, and the enhanced ClimatePulse Cycle – will provide favorable conditions for a very active and destructive hurricane season in 2024.
Professor David Dilley is predicting 20 named storms, 8 hurricanes with 3 to 4 of them being major hurricanes. The United States and Caribbean will have 6 Hot-Spots with 3 to 4 United States hurricane landfalls expected, and 1 or 2 in the Caribbean. In addition, there is the potential for 1 or 2 major hurricane landfalls.
GWO’s Hot-Spot Predictions 2023
Background Post: David Dilley: Signals of Global Cooling
Tom Nelson interviewed David Dilley last month and the video is above. For those who prefer reading I provide below a transcript from the closed captions, along with the key exhibits from the presentation.
Synopsis: Between the two oceans cooling down and the natural global cooling cycle coming down we’re going to see a big dip in the temperatures worldwide during the next 10, 15 years. The cold cycle’s going to take about 20 years to bottom out. We’re going to be in an extremely cold period during that time, colder than the 1960s and 50s here in the United States. So it’s going to be very cold.
TN: I have David Dilly here, and David could you tell us a little bit about yourself?
DD: I’m a meteorologist, climatologist, for which I have about 52 years of experience, and I’m still trying to figure that out because I’m only 30 years old. But but I’ve been in the business a long time. I was a weather officer in the Air Force in the National Weather Service. Then I left to set up my own company called Global Weather Oscillations; the easiest way to remember it is global weather cycles.com.
So we’re going to take a look today at something that NOAA is really talking about: the Carbon Dioxide and Climate Cycles. They’re just talking about today’s carbon dioxide values as far as the fossil fuel is concerned. You’re not going to see this out there anywhere on the web. It’s 78% of the atmospheric gases is nitrogen of all things, 21% is oxygen, 0.9 is argon that is 99.99 percent the atmospheric gases. That doesn’t leave much that’s just about all of what we call dry air. To be non-dry air includes the greenhouse gases. The greenhouse gases now are variable regarding how much of it is water vapor how much of it is carbon dioxide. Water vapor is anywhere from one to four percent of the atmospheric gases, that’s quite a bit. It can be zero percent of the Arctic and Antarctic because that’s a desert, but it can be all the way up to four percent. So one to four percent we’ll say.
Carbon dioxide of all things it’s a trace gas it’s less than .05%, a lot less than than water vapor. less than .05 now to put it in perspective, let’s just look at the greenhouse gases here and what we see is water vapor we’re gonna do the average of it two percent that’s 20 000 parts per million. Natural carbon dioxide what I’m going to show you later on in the presentation is 380 parts per million.
Now NOAA and the IPCC say it (natural CO2) is down around 285 parts per million,
we’re going to show you that’s false.
And so the natural is point zero four percent of the atmospheric gases, while fossil fuel I’m going to show you it’s only 35 parts per million; that’s point zero zero four percent or four one thousands of a one percent. And do you think that can cause climate change?
Of course not. We go down to Vostok in the Antarctic and there is a very deep frozen lake where they drill down fifteen thousand eight five hundred and eighty eight feet down to the bottom. That’s a long ways down over 500 000 years. So I take core samples and with the core samples they figure out how how much it is carbon dioxide what the temperatures are. These are approximate, but what they they get from a core sample is a an estimate of the temperatures and carbon dioxide during the past 500 000 years.
If we go back say 450 000 years, the red line is temperature. So what happened, we came quickly just in a few thousand years out of a deep Ice Age into a interglacial warm period. You can see the temperatures really slid up and the ice cores estimate the carbon dioxide to be right around 280 parts per million. Then we slide down out of the warm period into a deep Ice Age and you can see that the carbon dioxide is actually staying up high there. If carbon dioxide caused global warming, why did the temperatures drop; it does not make sense.
Eventually the carbon dioxide goes down because it’s being absorbed by the oceans. The oceans keep absorbing it over the course of a hundred thousand years. Then when you come up on your next interglacial warm period 338 000 years ago, the temperature goes up and the carbon dioxide is released from the oceans back into the atmosphere. And you can see the carbon dioxide lags behind the temperature rise and actually when you hit the peak of the temperature back 338 000 years ago, the carbon dioxide does not Peak out until 7000 years later. It takes quite a while but carbon dioxide peaked out at 298 parts per million. But look at that temperature then dropping quickly into an ice age while carbon dioxide is at its peak.
That’s proof right there the carbon dioxide does not cause global warming.
As we come over on the right hand side of the graphic this is about 18 000 years ago. It’s 11 000 years ago we came out of the glacial period, we warmed up quickly, we got up to about to 190 parts per million.
Then we started to take records in Hawaii in the 1950s and the instruments there said: Wow, all of a sudden now we’re up to 412 parts per million. We’ve never been that high before. This is what we’re going to investigate: what is going on with the glacial periods and also the core samples. This is a graphic of the carbon dioxide. The peak of The inter glacial warm periods is every 120 000 years ago we’re going back 800 000 years.
Now do we have other research that will confirm what I’m saying. This is about a year ago and they’ve been adding papers to it and this corrects NOAA’s calculations of the rise in carbon dioxide since 1850. It’s in a radiation safety Journal Health physics journal and this is the name of the paper itself. The authors are professors of radiological Sciences. They’re retired and that’s a big thing because if you’re not retired, if you’re at a university, you can’t do research like this because of federal grants and everything. You have to wait until you’re retired and then you can do real science when they were working they were at the department of physics at University of Massachusetts. It’s Kenneth Skrable, George Chabot, and Clayton French and here is what they found.
This is extremely important. Since 1850 the red here is saying the increase due to fossil fuel, and they’re showing all of that is the increase due to fossil fuel. Now how do we determine that well up on a high mountain in Hawaii we have a infrared spectrometer since 1958 it’s been been taking measurements of atmospheric carbon dioxide. However three Isotopes of Carbon are 12, 13 and 14. and the spectrometer is taking the total of all three. It’s not separating what is natural from what is fossil fuel.
Because the ice core samples say we’ve never been above 300 parts per million
NOAA is assuming that the rise above 300 parts per million is all fossil fuel.
An assumption is all it is. It’s assumed by trying to take averages of how much CO2 is taken back in by the oceans how much of it is a given not from industry. Taking those assumptions some physicists made a formula to determine how much is fossil fuel and how much is natural going back all the way back to 1750. These red lines again are what NOAA says is the increase by fossil fuel.
Well their formula separates the carbon 12, 13 and 14 to determine what is what and this is their findings as I switched everything over to green. Green is the natural increase in carbon dioxide all the way up to 1958. Now remember it’s a paper going back to 2018, but it says the increase has been from 280 parts per million up to 408 and NOAA says it is all from fossil fuel. This research paper says No, it is nearly 80% natural just like what I showed on my formulations, eighty percent natural, onlyabout 20% industrial. That’s not enough to cause climate change.
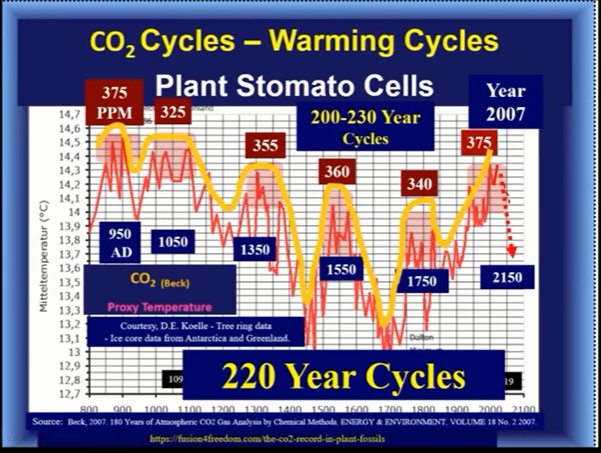
Now I’m going to show you one last paper that will also verify the findings and this is using a different method fossilized plant leaflets and as you can see in this picture there’s little cells in there they call these stomata cells which are like the lungs in a human being. So they look at the fossilized plant leaflets and unlike the ice core samples where you’re taking an average over one thousand or four thousand years, the fossilized plant leaflets can give you the exact year going back the past thousand years so you can determine each year what is going on.
So the stomata cells are like the lungs in a human being or in animals but he’d found that if the leaflet has a lot of stomata cells it means a lot less carbon dioxide in the air at that time. When CO2 is plentiful, plants don’t need more oxygen lung power to get the carbon dioxide; if it has fewer cells that means there was a lot of carbon dioxide in the air.
And the beautiful thing about plant life taking in carbon dioxide is the byproduct is oxygen which we drastically need. What the plant stomata cells show during the past 1200 years: back in 800 A.D it says we were way up to 375 parts per million natural carbon dioxide and then dipped way down to 325 in one thousand A.D. Then it dipped way down to 230 and it dipped up down, up down, up down up, down. In year 2010 it was up at 375 parts per million.
Let’s look at the plant stomata that could be pretty darn real and also if you take a mean value of the plant stomata over the course of a thousand years you come out 301 parts per million. The main value of ice cores over a thousand year period 297 parts per million really darn close to being the same as now. Let’s take the plant stomata readings of the atmospheric carbon dioxide and overlay it onto our global warming and cooling Cycles during the past 1200 years. We have had six global warming Cycles during the past 1200 years as noted here in the red. This is back around 850 A.D and then you can see it cools down then we warm up again, cool down warm up cool way down and so on for six global warming cycles. People don’t talk about that but we have had six of them.
When we overlay the plant stomata atmospheric carbon dioxide, guess what: We see a perfect fit. The high values in carbon dioxide peak on global warming cycles, so that brings a lot more credibility into the plants stomata cells for recording carbon dioxide.
So putting it all together we since 1850 NOAA and the IPCC say that the rise in atmospheric carbon dioxide is 100% due to fossil fuel and human activity. The three studies I just showed you and the corrections I made on the ice core samples all show it’s 80% natural rise. Far too little fossil fuel effects to cause climate change, it is almost all natural.
Here we are today over here on the right the average is a global cooling cycle comes about every 230 years and the global cooling cycles last for a good 100, 150 years. So here we are right now, average for the return of the global cooling cycle is 230 years and the last global cooling cycle began in 1794. Add 230 to that and you calculate the year 2024.
This is 2023. so we should be sliding into a global cooling cycle, a natural global cooling cycle.
And we have signals that it is beginning. Global warming Cycles begin in the Arctic and the Antarctic when they warm up over the course of 20, 30 years or so. And as the Arctic and Antarctic warm up there’s less cold air available through the mid-latitudes. So over time the mid-latitudes warm up so that’s where global warming spreads.
In the next phase, global cooling also begins at the Arctic and the Antarctic.
What has happened just this past year, the spring and summer in the Arctic was the coldest on record. You had that during a global warming period, so that’s a signal that the Arctic is drastically cooling down. In 2021 the Antarctic had the coldest winter on record. How you have two records like that if you’re not sliding into global cooling? There’s more cold air available and it’s going to cool down the mid-latitudes and that starts our global cooling cycle. And we’re coming into that right now. Winter 2020 was a third coldest January and February on record from Alaska through Central Northern Canada into Greenland. Antarctica as I indicated winter of 2021 coldest on record. Arctic 2022 coldest spring and summer on record since 1958, and the most Arctic Ice extent in 8 to 16 years.
The real main point is carbon dioxide increase is mainly natural, it is not causing a global warming cycle. It’s a natural global warming cycle and we’re sliding back into a natural global cooling cycle.
TN: If you had to make a prediction what would you think of the cooling between now and 2050. Do you think it will cool between now and 2050 are you fairly confident?
DD: Actually we’re going to see a pretty good cool down here into January. The whole atmospheric circulation is beginning to change the La Nina out in the Pacific is now fading it’s going to be gone here by mid to end of January, and we can see changes in the atmospheric circulation going on now. The cold air in Canada is going to start making its way down more into the United States during late January.
For this year we do see the drastic change and what we’re going to see really well through 2050 or so. The IPCC and NOAA say that the oceans are going to rise anywhere from eight to 26 inches during that time period. I say it may rise an inch, maybe not even that much because we’re going into a global cooling cycle now. The poles are cooling down.
Pacific Ocean has phases going back to the year 1580. For past 500 years we’ve seen these warm phase and cold phase Cycles in the Pacific Ocean which last for anywhere from about 25 to 40 years. The Pacific has been in a 40-year warm cycle which ties the record going back uh 500 years. Pacific is sliding into a cold or a cool phase ocean water cycle, and that’s going to help to cool down ,especially up around Alaska. And the Atlantic Ocean will be going into a cool phase of its own right after 2030 or so.
Between the two oceans cooling down and the natural global cooling cycle coming in we’re going to see a big dip in the temperatures worldwide during the next 10 to 15 years.
The global warming cycle took about a 20-year period to peek out warming from about the year 2000 up to about 2021 so it took 20 years to hit the peak; the cold cycle is going to take about 20 years to bottom out also at the coldest and that’s going to be around 2040 or so. Unitil the late 2030s so we’re going to be in an extremely cold period during that time, colder than the 1960s and 50s here in the United States.
TN: Is there any sort of a simple explanation as to what causes that 230 year cycle that you mentioned?
DD: The simple explanation is our glacial periods and interglatial periods become about every 120 000 years are due to the Earth path around the Sun; where the Earth swings out further away from the Sun and also the tilt of the earth also changes.
New data out is showing that we’ve actually been cooling down during the past five to six years. So this is all looking like we are already going gradually into a global cooling Cycle. But we’re going to see a more dramatic change in the cooling cycle.
What NOAA and IPCC are doing, their science is political science while we’re looking here today at real science. There’s a huge difference. Keep your eyes open the next few years and all of a sudden in a few years people are going to be saying: Wait a minute, what are we doing here? We’re down the wrong path we need to wake up.
Comment:
The underlying issue is the assumption that the future can only be warmer than the present. Once you accept the notion that CO2 makes the earth’s surface warmer (an unproven conjecture), then temperatures can only go higher since CO2 keeps rising. The present plateau in temperatures is inconvenient, but actual cooling would directly contradict the CO2 doctrine. Some excuses can be fabricated for a time, but an extended period of cooling undermines the whole global warming mantra.
It’s not a matter of fearing a new ice age. That will come eventually, according to our planet’s history, but the warning will come from increasing ice extent in the Northern Hemisphere. Presently infrastructures in many places are not ready to meet a return of 1950s weather, let alone something unprecedented.
Public policy must include preparations for cooling since that is the greater hazard. Cold harms the biosphere: plants, animals and humans. And it is expensive and energy intensive to protect life from the ravages of cold. Society can not afford to be in denial about the prospect of the current temperature plateau ending with cooling.