

Image courtesy of Mars: Dry Ice and Dunes – NASA Science
John Bruyn writes at Quora answering the question: What does carbon dioxide have to do with climate change? He is a retired geophysicist with a background in exploration geology, geophysics, seismology, and in remote sensing by satellite. Excerpts in italics with my bolds and added images.
The surface of Mars shows that CO2 is transparent to radiation in the visible part of the electromagnetic spectrum until it becomes reflective as dry ice at temperatures below its -78.5 C (109.3 F) freezing point. A black body radiating at such temperatures does so at wavelengths close to 15 µm (microns), i.e., very low energy at the far end of the far infrared part of the electromagnetic spectrum.

Energy is a function of frequency and should therefore be plotted on the x-axis (top of this figure) and units of watts should not be included on the y-axis. The colored lines show the spectral radiance predicted by Planck’s law for black bodies with different absolute temperatures. The energy of radiation absorbed by carbon dioxide is near 0.08 electron volts (green circle) while the UV-B energy that reaches Earth when the ozone layer is depleted is near 4 electron volts, 48 times larger.
Such radiation is inconsequential on Earth where the much higher global mean surface temperature of about 15 C (59 F) makes that impossible and irrelevant in that it would violate the 2nd law of thermodynamics. The exception would have to be mid-winter on central Antarctica where the temperatures can get as low as -90 C (-130 F) but where the roughly 0.042% (420 ppm) CO2 concentration leaves the partial pressure too low for dry ice to form. As that minimum temperature shows, any infrared radiation disappears quickly into space at close to the speed of light.

The extra carbon atom makes CO2 more massive than air and
at 0.042% that concentration is critically low for photosynthesis.
Any CO2 we can conribute only serves to improve on that. The reason for that very low concentration is the very much greater abundance of the lighter than air H2O molecules bonding with CO2 inversely proportional to temperature to suspend it temporarily. However, that is restricted to the troposphere with 99% of the Earth’s atmospheric H2O that relies on the bonding with enough CO2 molecules to be able to precipitate and fill water bodies on land and the ocean, currently taking up almost 71% of the global surface. Helping H2O precipitate makes CO2 a cooling agent, including by supporting photosynthesis and ozone formation in the stratosphere.

It follows that the atmospheric CO2 concentration is controlled by the amount of water vapour in the air and that its concentration rises and falls with the variations in insolation and from variations in the speed of the Earth’s rotation. Together they drive the evaporation of H2O from global surface, as well as the CO2 emissions from the ocean in the tropics. Cooling and the declining speed of the Earth’s rotation toward higher latitudes cause evaporation and the ocean’s CO2 emissions to decline with latitude and to reverse that process, as well as making the ocean the world’s primary carbon sink.

The Milankovic cycles have been concentrating insolation in the tropics with the declining obliquity of the Earth’s spin axis for the last 10 millennia. Perihelion has been adding to that by moving north since the mid-13th century. The declining eccentricity of the Earth’s orbits has been adding to that by increasing the already supersonic speed of the Earth’s rotation and will continue to do so for about another 30,000 years. The increasing the centrifugal force (inertia) has been causing the atmospheric CO2 concentration to increase. However, as sea levels continue to decline at the highest latitudes (see Post-glacial rebound – Wikipedia) and will cause the shallow seas in the tropics to start running dry in about 5 millennia from now, CO2 emissions will start to decline accordingly.

This plot shows the day length (LOD) variations from Wikipedia and how these have been shortening by milliseconds as a result of the increasing speed of the Earth’s rotation from the declining eccentricity of the Earth’s orbits.
The oscillations match the the variations in the sun’s barycentric motions caused by the gravity and orbits of the 4 outermost planets (JSUN) with 99.6% of the planetary mass that control the ~11-year solar cycle, as well as the sun’s ~22-year magnetic cycle due to the vertical motion of Jupiter and Saturn with respect to the plane of the solar equator caused by the inclinations of their orbits with respect to that plane and controlled by the orientation of the gravity of the Milky Way galaxy.

These are the solar orbits around the barycentre of the solar system from 1970–2022 as generated with the Solar Simulator 2 (can be downloaded free of charge, no strings attached). As can be seen from the prior LOD image, the SS2 shows that when the solar motion is small, day lengths increase and when the solar orbits are large, day lengths reduce. This makes it highly probable that the minute changes in the global mean temperatures by fractions of a degree that may be picked up with climate models are from the annual variations in day lengths instead of CO2 increases.

This graph (own work, based on NASA JPL Horizons ephemerides) shows that the changes in the Earth’s climate have been happening as a result of the changing shapes of the JSUN orbits for the last 2 millennia (and before that) and their always changing perihelion distances. They show the real reasons for climate change with a 973-year millennial cycle, as well as the roughly 60-year cycle of the phasing of the orbits and great conjunctions of Jupiter and Saturn according to the 5:2 ratio of their orbital periods of 12 years and 29.5 years respectively.
The ~60-year great conjunction cycle of Jupiter and Saturn has long been recognised by ancient astronomers and in the Chinese calendar. The cycle peaked in 2019 and the vertical motion of all 4 of the outermost planets, Jupiter (318 E-mass), Saturn (95 E-mass), Uranus 14.5 E-mass), and Neptune 17.1 E-mass) to a total of 99.6% of the planetary mass all converged well south of the plane of the solar equator in 2022, pulling the Earth with just 0.22% of the planetary mass a bit further south too and exposing more of the northern hemisphere to the sun. And that’s just one of the anthropogenic global warming (AGW)/climate change tricks, cherry picking the hemispheres and the poles at certain times.

This image (own work) of the vertical motion of the 4 outermost planets (JSUN) with 99.6% of the planetary mass shows that according to the NASA JPL Horizons ephemerides their orbits put all 4 of them well below the plane of the solar equator with the effect of forcing the Earth orbits a bit further south too and exposing the Arctic to more insolation.
At the temperatures of the troposphere are above the freezing point of CO2 it is transparent to electromagnetic radiation., but not when frozen as dry ice in the lower stratosphere with sub-100 C temperatures. In the troposphere, the up to 100 times higher concentration of the lighter than air H2O molecules suspend the CO2 molecules and prevent these from forming a dense high pressure high temperature surface layer as they do on Venus where 1 day takes longer than a year.
It follows that driving the best and the largest evaporative cooling and air-conditioning system on Earth is the centrifugal force (inertia) of the supersonic roughly 1,677 km/h (1,042 mph) equatorial speed of the Earth’s rotation and mountain ranges that spins CO2 out into the upper atmosphere. On the way back down, CO2 loses its energy in the lower stratosphere and freezing when reaching -78.5 C to become reflective as dry ice but that radiation, where and when it happens is too weak to have any effect on a much warmer troposphere where CO2 gets defrosted by bonding with H2O molecules and helping these condense, form clouds, and precipitate as slightly acid rain, pH of 5.6 or less but increasing inversely proportional to latitude. The reason for that upward pH gradient toward the poles is from H2O requiring fewer CO2 molecules to precipitate as temperatures decline and the centrifugal force (inertia) of the Earth’s 24-hour rotation period goes to zero. The Earth’s oblateness also causes gravity to increase to its maximum by bringing the surface at the poles closer to the Earth’s core.
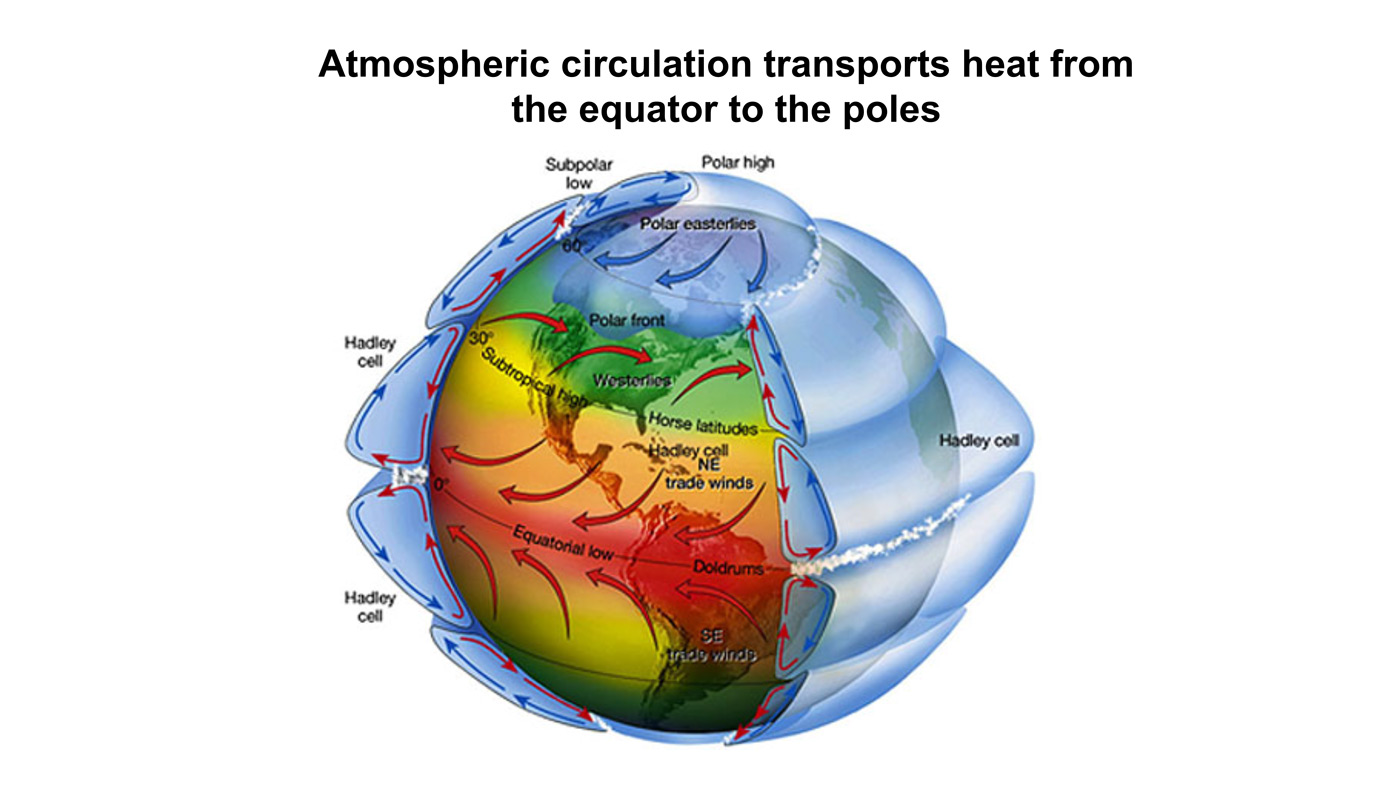
So, the simple proposition is that in the tropics, where the intensity of solar radiation is the greatest, where humidity and cloud cover are the highest, and where the surface temperatures are high, water in the atmosphere does more reflecting while transporting solar energy to higher latitudes to precipitate and where opposite conditions make water in the atmosphere do more reflecting of surface energy as infrared radiation. However, as we well know, water does not reflect all of the surface energy but lets a lot of that through to still leave a substantial cooling effect, as can be noticed from snow and ice accumulation. It means that what shade cloth is to solar radiation in warmer climates, moisture in the air is to surface radiation in colder climates. And, deserts show that where moisture is low, the temperatures plummet overnight.
Simply put, we cannot have any control over Earth’s global mean temperatures without significantly increasing the supply of solar energy or changing the distribution of insolation, to melt some of the snow and ice in the Arctic or on Antarctica and raising sea levels. Doing so artificially would reduce the impacts of the impending ice age to some extent (not to be advised from an evolution point of view) by maintaining higher sea levels and keeping the continental shelves covered by water instead of drying out as they are known to have done during the last few ice ages and on the last occasion permitted our early-ancestors to leave Africa and migrate to other continents.
It follows, that as a ‘greenhouse gas’ CO2 is irrelevant by doing the opposite of what is claimed in support of the climate change hoax and Ponzi scheme, aimed at making us change over to alternatives energy sources to fossil fuels to prevent these from running out during the further cooling of this millennium, as well as making some people a hell of a lot of money. Not the least in that are Elon Musk and the oil, gas, and coal companies that love the higher energy prices from Saudi Arabia cutting back oil production but most tragically also fuelling past and present oil wars including the current wars in Ukraine and Gaza.
And in the Longer Term, Geoclimatic forces will continue to operate:
So Remember This . . .

via Science Matters
May 11, 2024 at 01:45PM

