Month: May 2024

Tell the world, the Dutch tractor protests and a War on Net Zero won

Dutch Netherlands Farmers Protest

Dutch Netherlands Farmers Protest

By Jo Nova

Six months after Geert Wilders won the Dutch election he has finally negotiated an agreement with a few minor parties to form government and the unthinkable has happened. The centre-of-the-road conservatives (referred to as “far right extremists”) got elected to unwind the worst excesses of the totalitarian left. Henceforth, the forced farm reclamations will stop, mandated heat pumps are out, electric car subsidies are going and in a brave scientific move, no one will be culling livestock to change the weather. The Netherlands won’t have to pursue stronger environmental policies than the rest of the EU so their leaders can show off at cocktail parties and get jobs with the UN. The Netherlands will still be tied to crazy EU rules, but those elections are coming next month. And official government ministers are so much harder to ignore in EU negotiations.

The Telegraph in the UK gets the message: The Tories should go to war on Net Zero. This applies everywhere else too. Tony Abbott didn’t win a 90 seat landslide victory in Australia by trying to do half a carbon tax. He won because he said he would Axe the Tax. (And Stop the Boats.)

The political candidate who goes to war on Stupid Plans has the freedom to point out the all the stupidity. The weaker man with a halfway plan is still agreeing with the witchcraft, he’s just suggesting a different spell. No wonder it doesn’t sell.

To arrange the deal Wilders gave up the Prime Ministership (a win no doubt for the namecalling mud slingers), but he appears to be the one in charge nonetheless. We hope he gets his day…

h/t to NetZeroWatch

Dutch farmers force heat pumps about-turn

London and The Telegraph

The Netherlands will tear up rules forcing homeowners to buy heat pumps as part of a war on net zero by Geert Wilders and the Dutch farmers’ party.

Six months after his shock election victory, Mr Wilders this week struck an agreement to usher in a Right-wing coalition government of four parties. “We are writing history,” he said as he announced the programme for the new government.

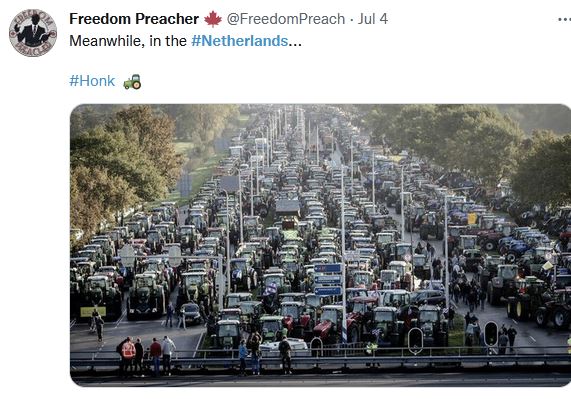
The new coalition marks the first time that a party focused on the interests of the agricultural sector has got into power in the Netherlands. Earlier this year, mass farmers’ protests swept Europe.

The coalition pact includes pledges to reverse green policies introduced under the previous government to hit EU climate targets, including compulsory buyouts of polluting farms. It also plans to end subsidies for electric cars in 2025 and rejects an EU demand that the Dutch reduce livestock numbers to cut pollution.

The Tories should go to war on net zero excess

Editorial, The Telegraph

But now even Western countries are starting to turn against the worst excesses of the green movement. The new Dutch coalition has released its programme for government, and at the heart of it are a swathe of pro-consumer, pro-energy security policies, reversing some of the bizarre environmental schemes introduced by its predecessors.

Among them was a programme to compulsorily purchase farms to meet EU climate targets. The result was a farmers’ revolt and a new insurgent political party. The coalition agreement tears up rules forcing homeowners to buy heat pumps, and scraps an obligation that the Netherlands should pursue a “more ambitious environment policy” than the rest of Europe.

Young voters are shifting right and breaking “taboos”

Politico writers are worried that the “taboos against voting for populist anti-immigration parties is fading”. Which begs the question of who decided that was taboo in the first place?

Their biggest fear is that even young voters are breaking out of their educational pens. They paint this as a devious “far right” opportunity, instead of what it really is, just the pendulum swinging back to normal. The old jargon and namecalling formula to bully the workers into submission isn’t working any more.

Geert Wilder turned all corners of Dutch Society into far right voters

By Hanne Cokelaere and Eva Hartog,  Politico

Across Europe, far right parties are advancing with support from young — and first time — voters. Despite being one of the EU’s wealthiest countries, the Netherlands’ shortage of affordable housing has become a key concern. Amid rising prices, many have an increasingly cynical outlook on life. Unlike their parents and grandparents, this generation feels less restricted by party loyalties, making them more of a wild card and therefore an attractive pool of new voters for anti-establishment candidates.

“The older voter, who was still loyal, is dying; younger voters are going in all directions,” said Josse de Voogd, a Dutch researcher who has made electoral geography his specialty.

For far-right parties, that presents an opportunity.

Wilders’ success took many by surprise, but it is indicative of a broader trend: The taboo of voting for populist, anti-immigration parties is fading. In the June EU election, the European Parliament’s Identity and Democracy group is projected to reap the electoral benefits of increasingly broad support; also among young voters.

Young voters are looking for a strong leader and few men are as strong as Geert Wilders — the man who received countless death threats and lives under permanent guard, but keeps going.


0 out of 10 based on 0 rating

via JoNova

https://ift.tt/H68Rpgr

May 21, 2024 at 12:50PM

Climate Research Paper Finds Tropical Storm Variability Linked Mostly To Oceanic Cycles

It’s the oceans, stupid (not CO2)!

The latest climate information video released by the Germany-based European Institute for Climate and Energy (EIKE) presents a recent paper by Huang et al appearing in the journal Geophysical Research Letters: “Contrasting Responses of Atlantic and Pacific Tropical Cyclone Activity to Atlantic Multidecadal Variability

The paper examines the influences of Atlantic Multidecadal Variability (AMV) on global tropical cyclones (TCs)

The north Atlantic undergoes approximately 60-year cycles of warmer and colder than normal sea surface temperatures. These changes in thermal surface energy play a role on modulating climate globally, especially in combination with other oceanic cycles.

Compared to the AMV negative phases, the AMV positive phase “significantly increases tropical cyclone frequency in the North Atlantic, including those making landfalls,” The authors found. “The increase is explained by warmer sea surface temperature, higher relative humidity, increased relative vorticity, and weaker vertical wind shear under the AMV positive phase.”

“By contrast, AMV positive phase decreases TC occurrence over the western North Pacific and South Pacific, which is tied to stronger vertical wind shear and lower relative humidity. The opposite responses of TC activity to AMV positive are attributed to strengthened Walker Circulation between the Atlantic and Pacific.”

Under CO2 science, alarmists like to claim that tropical storms frequency is simply trending up and up due to manmade CO2 warming. But in fact, tropical storm frequency is far more linked to oceanic cycles.

The key points of Huang et al 2023:

So the next time we get an active tropical cyclone season, you’ll know that it has more to do with natural oceanic cycles, which we are unable to control, and it all has little to do with CO2 emissions which the media like to hype up.

Donate – choose an amount

via NoTricksZone

https://ift.tt/4Bgv6Ij

May 21, 2024 at 12:16PM

Rainergy

Guest Post by Willis Eschenbach

If aliens in spaceships saw our world, they wouldn’t name it “Earth”.

They’d name it “Water” because that’s what makes up more than 70% of the surface. And it’s also what controls the climate.

A couple days ago I stumbled across something I’d been trying to find for a while, a longer-term gridded global rainfall dataset. I finally located one at the Copernicus website. It runs from 1979 to December 2021. Here’s the global average rainfall from that site.

Figure 1. Annual average rainfall, 1979-2021

This shows some interesting aspects. The endless rainstorms of the intertropical convergence zone (ITCZ) are seen as the blue band above the Equator. The Pacific Warm Pool is marked by the blue blob of heavy rain north of Australia.


A short digression. The current central paradigm of mainstream climate science is that the change in global temperature is a lagged linear function of the change in total downwelling solar and longwave (thermal) radiation. In other words, forcing (which in the climate world generally means changes in downwelling radiation, hey, don’t blame me, I didn’t invent the term) rules temperature, and everything else averages out.

I hold a different view. I hold that a variety of emergent climate phenomena act in various ways, places, and times to thermoregulate the climate. One of the strongest of these phenomena is the daily emergence of tropical thunderstorms. When ocean temperatures exceed some local limit, thunderstorms form, rain falls, and the surface is cooled. As a result, in the current generally warming climate, we should expect an increase in tropical thunderstorms.


To investigate this prediction, I took a look at the rainfall trends. Figure 2 shows those, in millimeters per decade. Blue is getting wetter, and red is drying.

Figure 2. Rainfall trends, 1° latitude x 1° longitude gridcells.

As my theory would predict, the warming is leading to increased rainfall over the Pacific Warm Pool and around the Intertropical Convergence Zone.

However, the reason that I was looking for the rainfall dataset was not for the rain per se. It was because the rain is a measure of the evaporative cooling of the surface. The global average rainfall is about one meter per year. It takes ~ 80 watts per square meter (W/m2) of radiation over a one year period to evaporate one meter of seawater. In addition, there’s a cooling of another ~ 2.5 W/m2 due to the cold rain falling on the surface.

This means that globally, rainfall directly cools the surface by ~ 82 W/m2.

What I didn’t know until I got the Copernicus rainfall dataset was how that cooling is distributed around the planet. Here’s a view of that. Of course, it looks like Figure 1, only with different units.

Figure 3. Average ongoing cooling from rainfall, 1979-2021

The cooling is centered over the Pacific Warm Pool in the western Pacific. This is the warmest open ocean area. It’s well known that the average temperature of the Pacific Warm Pool never gets warmer than about ~ 30°C … and clearly, the 250+ W/m2 cooling of the warm pool due to rain is among the reasons.

Now, I wanted this information because it is a main part of the effect of clouds on temperature. The other main part is the separate and independent effect of the clouds on total radiation hitting the surface. Clouds warm some parts of the planet and cool others, by a combination of cooling by reflecting sunshine and warming by increased downwelling longwave radiation. Overall, these changes in radiation due to clouds cool the planet by about ~ 20 W/m2.  Here’s how that is distributed around the planet.

Figure 3. Average ongoing cooling and warming from the cloud radiative effect, 2000-2023

Note the spatial similarity between the surface cloud radiative effect and the cooling due to the rainfall. No surprise there.

Note also the system’s efficiency—the clouds’ cooling effects (rainfall + radiation) are focused on the warmest areas. And this is true at both the local and the global scale—thunderstorms form preferentially over local surface hot spots. This gives the most cooling for the smallest effort.

Adding these two different cloud effects together gives us a measure of most of the effect of clouds on the surface temperature. I say “most of” because there are some other cooling effects. These include:

  • Snow, sleet, hail, and graupel. Since these are frozen, there’s additional surface cooling from the melting of the ice.
  • Clear dry descending air around thunderstorms. Because most of the water as well as most of the aerosols have been stripped out of the air by rainfall, there’s far less water vapor and aerosols to absorb radiation leaving the surface. This allows for greater surface radiation making it to space, cooling the surface.
  • A cold wind from the condensation level of the atmosphere is entrained by the falling rain and hits the surface vertically. This wind then spreads out when it hits the surface, cooling a much larger surface area around each rain cloud.

Setting those other cooling effects aside for the moment, here’s the distribution of total cloud cooling (radiative plus rainfall) around the planet.

Figure 4. Full effect of clouds on the surface temperature

Note that rather than the ~ -20 W/m2 cooling from just the radiative effects of the clouds, the true effect of the clouds is about 100 W/m2, and there are large areas where the cooling exceeds -300 W/m2.

Next, we can take a look at the relationship between total cloud cooling (radiative plus rainfall) and surface temperature. This is clearest over the 70% of the surface that is water. Here’s that relationship.

Figure 5. Scatterplot, total cloud cooling (rainfall plus radiation) versus sea surface temperature. Each blue dot is a 1° latitude by 1° longitude area of the ocean surface.

This is exactly the shape we’d expect to see in a thermoregulatory system. As the sea surface temperature increases, the total cloud cooling reduces … but only up to about 26°C. Above that, the cloud cooling increases very rapidly, quickly becoming around -300 to -400 W/m2 of cooling as the sea surface temperature gets up close to ~ 30°C.

Now, the yellow line in Figure 3 shows the slope of the cloud cooling/temperature relationship, which is how much the cloud cooling changes for every 1°C of surface warming. And over at the right of Figure 3, that slope is ~ -100 to ~ -150 W/m2 of increased cooling for every 1°C of surface warming.

In closing, let me note that since 1950, CO2 has theoretically increased downwelling radiation by something on the order of 1.4 W/m2 … and that would be totally undone by a mere 1.4% increase in cloud cooling. In that context, bear in mind that global cloud cooling changes by up to 9% from one month to the next, and we never even notice …

[CODA] The important thing about cloud cooling is that it is temperature-controlled. It has nothing to do with forcing. When tropical sea surface temperatures go above about 26°C, it rains, regardless of the forcing. Period. See below.

Figure 6. Pacific equatorial rainfall, 5° north to 5° south.

My regards to all, and remember—rather than cursing the storm, learn to dance in the rain …

w.

As Always: Please quote the exact words you are discussing. It avoids endless arguments. And me, I’m going to be in town today when this publishes, so play fair, no eye gouging, and may the best wo/man win …

via Watts Up With That?

https://ift.tt/hrpRe5E

May 21, 2024 at 12:02PM

Electric vehicle subsidies as complex and costly as ever

BY DAVID WILLIAMS: EVs may be the most subsidized product in America.

via CFACT

https://ift.tt/lYmBJCe

May 21, 2024 at 10:29AM