
The recent record-setting UAH satellite-based temperatures of the lower troposphere can be compared to a different combination of satellite MSU/AMSU channels which help to corroborate the temperature trends from our “lower tropospheric” (LT) combination of channels.
The three channels we use for LT are MSU channels 2 (“MT”), 3 (“TP”), and 4 (“LS”), (AMSU channels 5, 7, and 9). The primary channel used comes from “MT” (MSU channel 2 or AMSU channel 5), which has the largest weight:
LT = 1.538*MT – 0.548*TP + 0.01*LS
But we have also experimented with a weighted average of MSU channels 3 (“TP”) and 4 (“LS”), (AMSU channels 7 and 9), which produces an averaging kernel in the upper troposphere (nearly insensitive to stratospheric cooling in the tropics, but somewhat sensitive to stratospheric cooling in the extra-tropics where the tropopause [the boundary between troposphere and stratosphere] is lower). This provides an independent check on our LT synthesized channel, keeping in mind one is centered in the lower troposphere and the other is centered in the upper troposphere.
We noticed that last month (May, 2024) produced a record warm global average temperature in the tropopause channel (AMSU channel 7), so I decided to investigate. Combining channel 7 and 9 for an Upper Troposphere (UT) synthesized channel
UT = 1.35*TP – 0.35*LS
produces the following temperature anomalies:
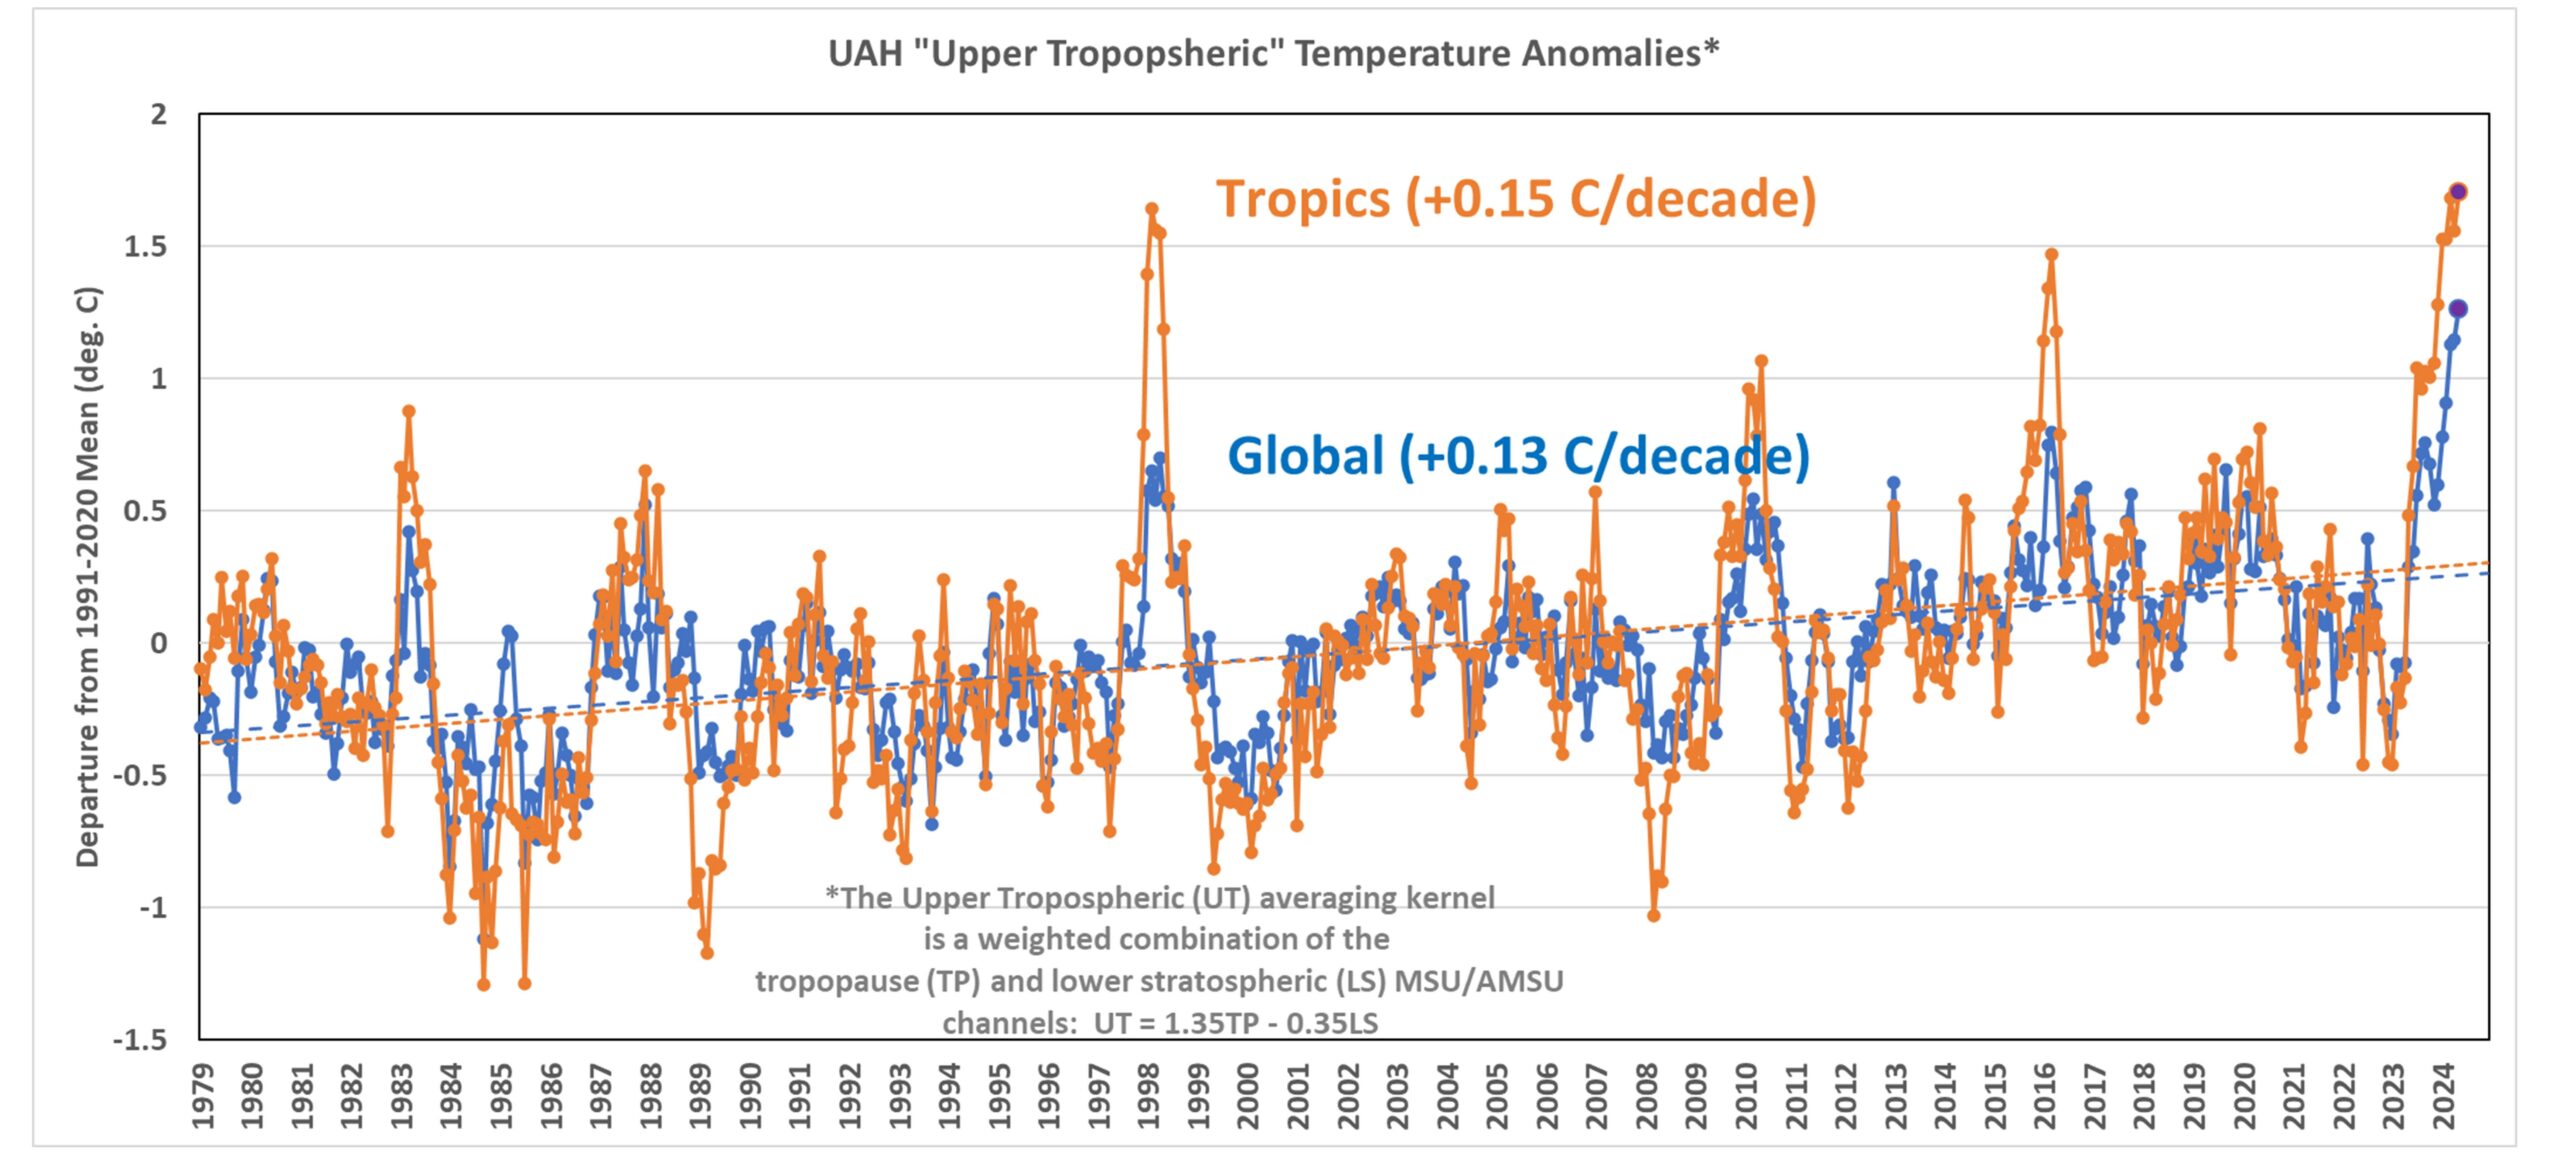
Note that for the global average, the synthesized UT channel reached record warm values in February, then March, then April, and then May, 2024.
In the tropics, March and then May produced records, but not by much… the 1997/98 El Nino produced upper tropospheric warmth nearly as strong as our recent El Nino.
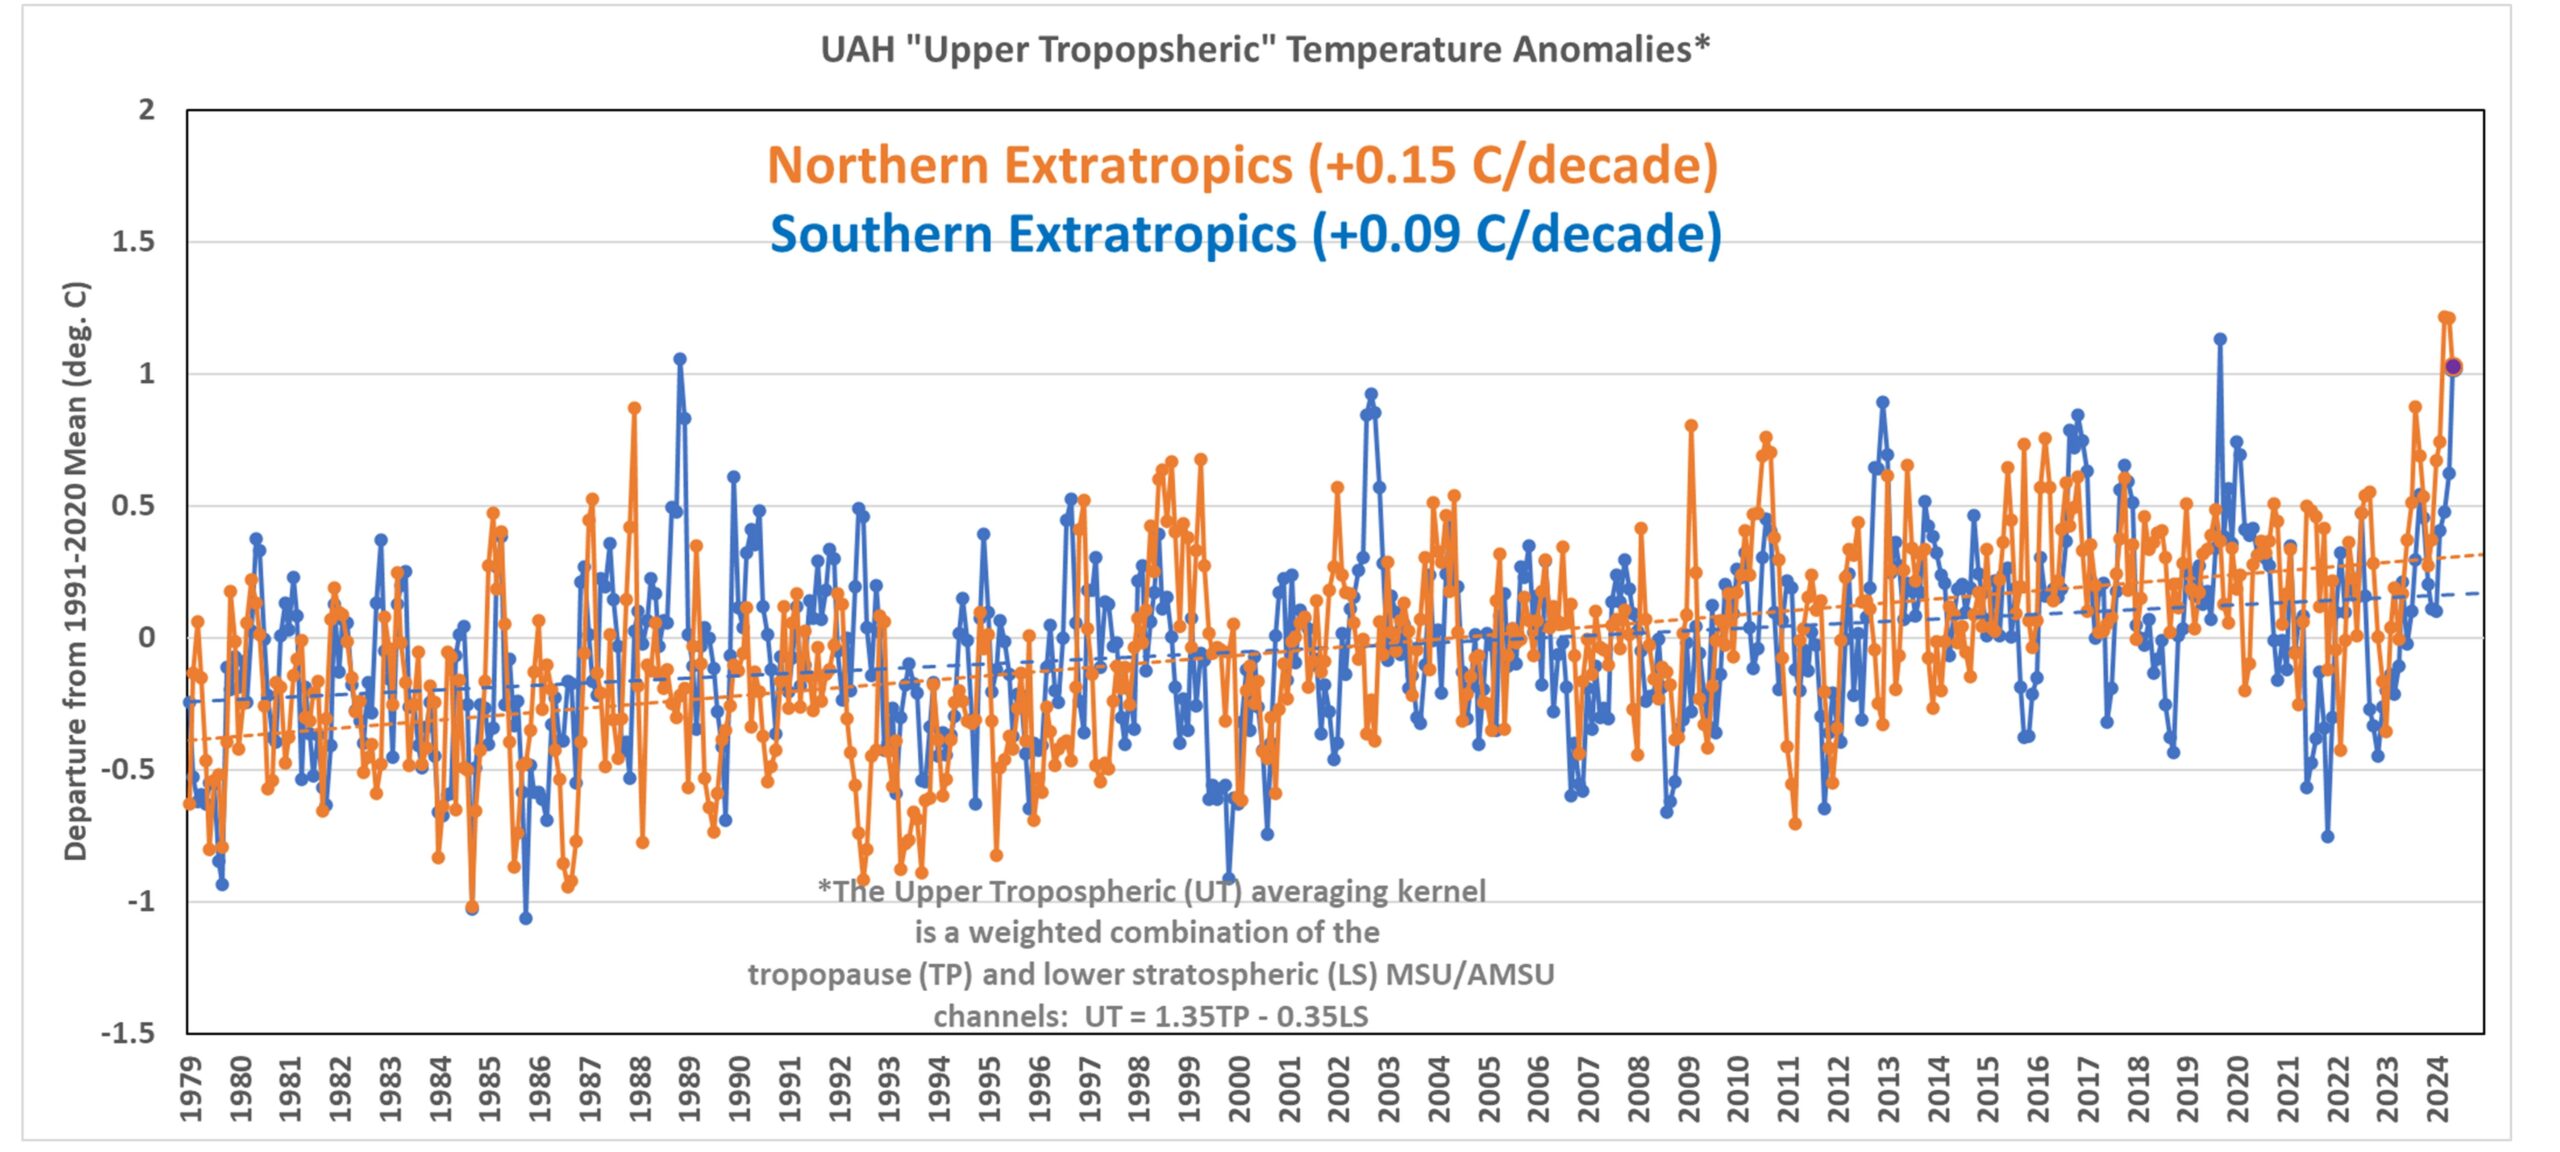
If we look at just the extra-tropics (next chart) we see the northern latitudes has record warmth in March. But the southern latitudes May cam in only 3rd warmest, behind September 2019, and November, 1988.
Note also that the global UT trend is the same as the lower tropospheric (LT) trend, +0.13 C/decade. Since the global UT has some small contamination from lower stratospheric cooling, the “true” UT value (if the stratospheric influence could be removed) would be somewhat warmer. By how much? I’m not sure… maybe +0.15 rather than +0.13 C/decade as an educated guess.
Taken together, I believe this shows that our traditional LT (lower tropospheric) temperature trends are basically corroborated by the other channels of MSU/AMSU.
Keep in mind that when John Christy and I compare these various trends to climate models, it is always apples-to-apples: the climate models’ atmospheric pressure level data are combined and weighted to approximate the same weighting functions as the satellite senses.
via Roy Spencer, PhD.
June 7, 2024 at 06:38AM
