
By Jo Nova
How much back-up do we need for our 11.5 gigawatt wind system? About 11.4 gigawatts.
Wind energy failed on Thursday at what must be close to a record low — with barely 88MW of production from 11,500MW of wind turbines. That’s about 0.7% of total nameplate capacity.
With construction costs running at $2 million for every theoretical megawatt of turbine, that’s $20 billion dollars of machinery sitting out there in the fields and forests of Australia producing about as much as two diesel generators.
We have 84 industrial wind plants across 5 states of Australia, and the green band below was their total contribution to our national electricity needs on Thursday — put your reading glasses on.
Things were even worse in Western Australia, where at the one point that afternoon when I happened to look the state’s total wind generation was minus 11MW. Some wind turbines were drawing a megawatt here and there, perhaps to keep the turbines rolling so they don’t get flat spots on bearings.
It was an attack of another climate-denying high pressure cell on Thursday. There was no place in Australia good for wind generation except (maybe) for our research stations in Antarctica.
Again, this is now a feature of our electricity grid, until the government can stop these high pressure cells or conquer New Zealand and build a bridge.
But sadly, there is no “building” our way out of this. One thousand more wind-plants won’t keep many lights on, and $100 billion dollars of interconnectors will not connect us to wind power if there is a high pressure cell 5,000 kilometers wide, which there is every two or three weeks.
Wind power went from producing 7.2GW in the early hours of Wednesday to 0.09GW by lunchtime Thursday. It was sheer luck it bottomed out at lunchtime on a sunny day when solar panels were at their peak. Seven gigawatts of power disappeared in just 36 hours. If we lost 7 gigawatts of coal plants in a week, we’d never hear the end of it.
It’s the minimums that matter
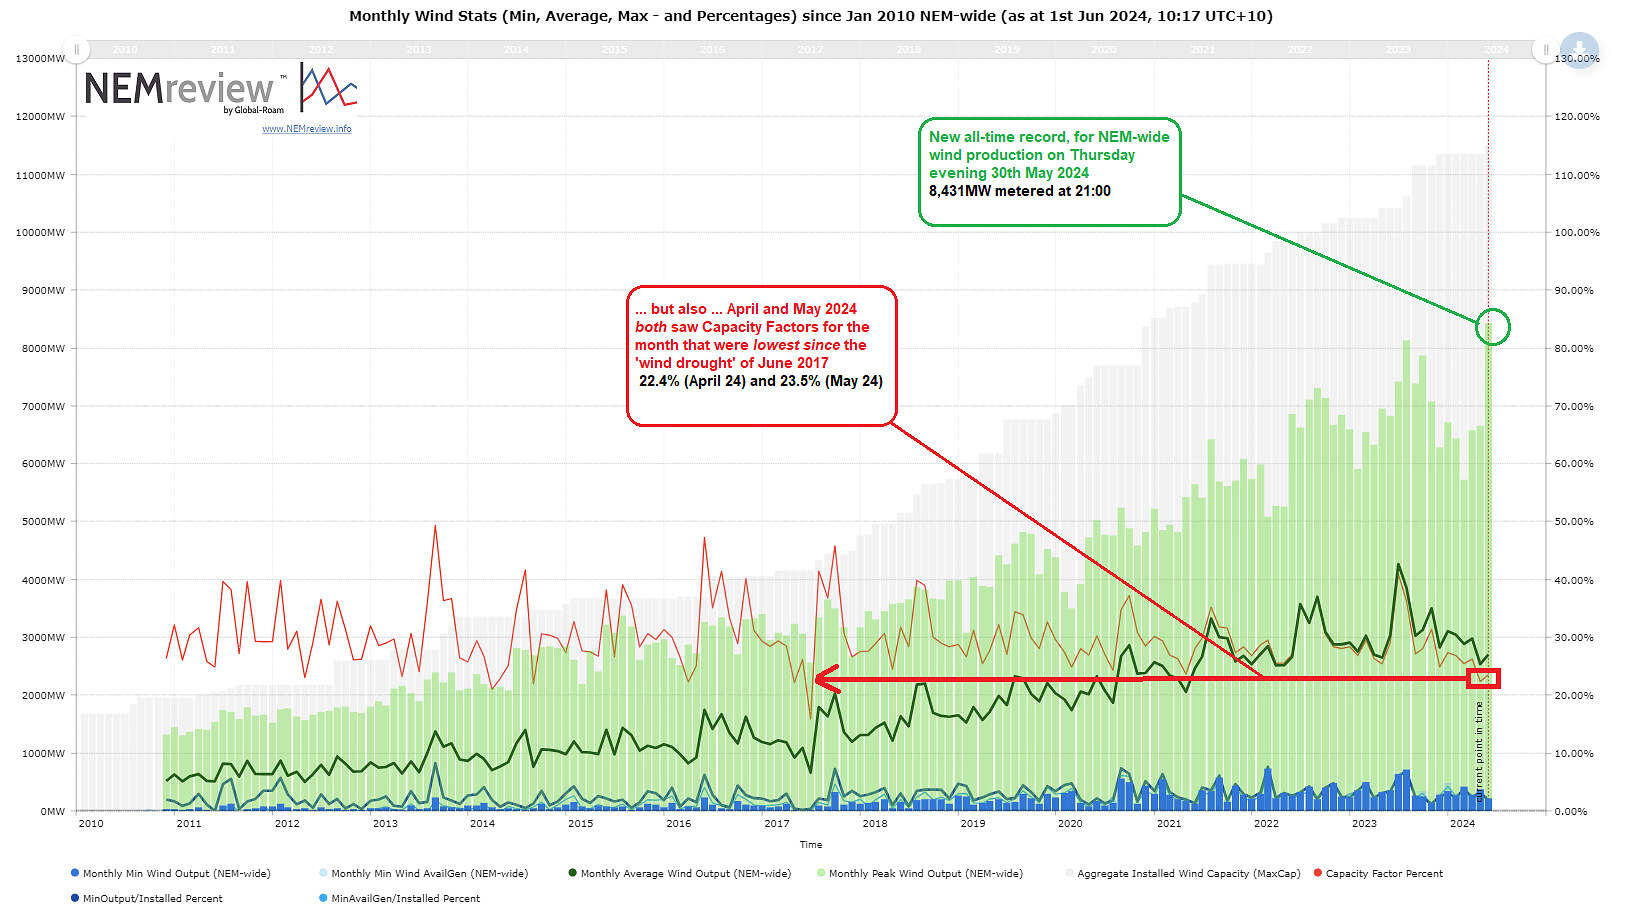
Paul McArdle at WattClarity has all the grid data, and provides an amazing graph of the system-wide peaks and troughs of our wind generators over the last 13 years which he has updated recently to highlight how bad the months of April and May were for wind production in Australia. Click to enlarge this graph to really appreciate the devastating message. While the total wind farm “capacity” has grown massively (the grey columns on the graph), the minimum lowest guaranteed production has not shifted much at all. This is the generation we can rely on, the minimum monthly points are marked in dark green at the bottom.
Ten years ago the lowest monthly minimum was practically zero (reaching just 3.7MW one day in July 2014). But since then we’ve built 8,000 MW of extra wind power, at an effective cost of $16 billion, and only bought ourselves effectively two diesel generators worth of reliable electricity?
Source: WattClarity
If someone asks how much wind can we rely on, the answer is “about one percent”.
h/t Apoxonbothyourhouses
0 out of 10 based on 0 rating
via JoNova
June 14, 2024 at 04:05PM
