Month: June 2024

Licenced to Kill: Wind Industry’s Atlantic Whale Slaughter Gets New Govt. Greenlight

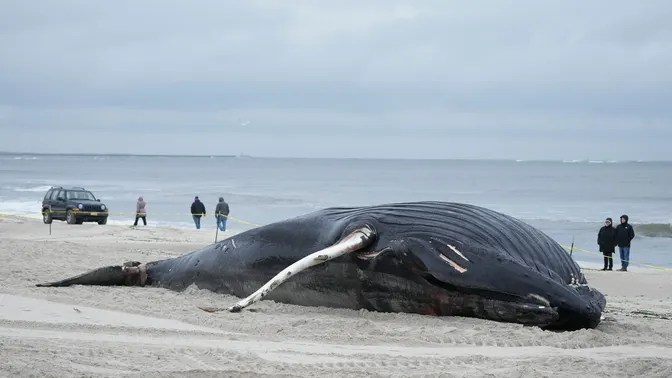
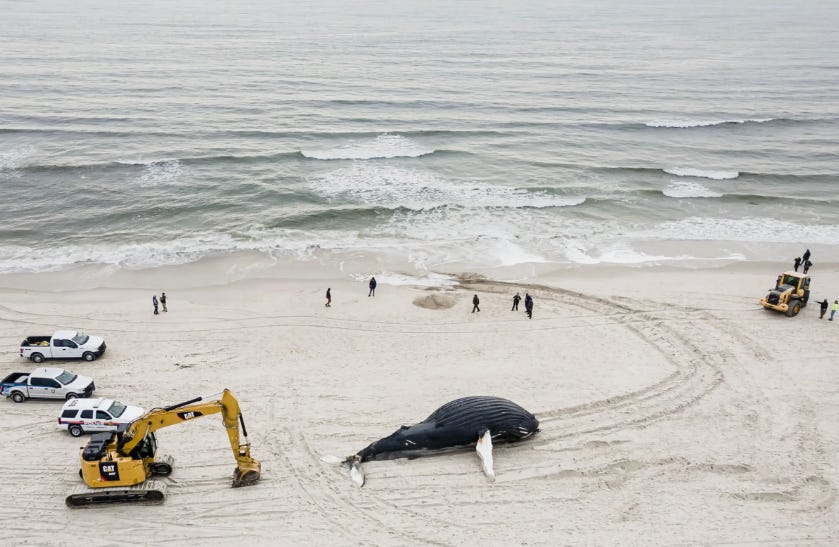
The wind industry’s licence to kill whales and other marine mammals is the perfect example of institutional corruption. As the cetacean carnage continues, one might think that the US government might pause (just for a moment) and consider revoking their ‘take permits’ – rather than simply continuing to green light the wind industry’s wholesale whale slaughter. But, not a bit of it, as Vijay Jayaraj explains in the first piece below.

As we have outlined on numerous occasions, the principal cause of whale (and other marine mammal) deaths is the noise generated during the construction of these things offshore, which is the subject of the second piece by Rob Rand, one of America’s leading acoustic experts.

NOAA Permits Wind Energy Operators to Harass and Kill Whales
California Globe
Vijay Jayaraj
29 April 2024

Wind energy is clean and green. It is the magic switch to turn off global heating. And unicorns are real. You may name your most cherished illusion among those three if you please. But it will not change the fact that the National Oceanic and Atmospheric Administration (NOAA) and wind energy companies are complicit in a state-sanctioned, modern-day butchery of marine mammals along the U.S. East Coast.

NOAA-issued permits allow each operator of wind turbines to kill or harass 100s of whales annually, a fact that climate doomsayers and green energy enthusiasts ignore or deny in a manner reminiscent of flat-earthers dismissing photographs of our blue sphere suspended in the void of outer space.

NOAA: From Whale Hero to Whale Villain
On its website, NOAA claims that it works “to protect marine species populations from decline and extinction, conduct research to understand their health and environment, and evaluate and monitor human activities that might affect them to ensure future generations may enjoy them.”

NOAA says that the Marine Mammal Protection Act requires it to protect all whales, dolphins, porpoises, seals, and sea lions from “take” by U.S. citizens in the nation’s waters. “Take” is NOAA lingo for harassing, hunting, capturing, killing or attempting to do any of those.

However “exemptions” to this protection are granted to allow lethal and non-lethal interference with cetaceans — whales, dolphins and porpoises — by wind energy developers along the Eastern Seaboard.

Known as “Incidental Take/Harassment Authorizations” (IHAs), these exemptions give wind operators latitude within the regulation to kill and harass marine mammals while carrying out sonar surveys for site characterization and other activities related to construction and operations.

The species authorized to be harassed in these IHAs include the endangered North Atlantic right whale, fin whale, sperm whale, sei whale, minke whale, humpback whale, long-finned pilot whale, Atlantic white-sided dolphin, common bottlenose dolphin, short-beaked common dolphin, Atlantic spotted dolphin, Risso’s dolphin, harbor porpoise, harbor seal and gray seal.

For example, Bluepoint Wind, LLC, is allowed to kill or harass 270 whales, including 11 right whales and 149 minke whales between March 2024 and February 2025 in the coastal waters of New York and New Jersey, a region known as the New York Bight. The “harassment” quota includes other marine mammals as well.

Other active IHAs for wind operators include the following: Dominion Energy Virginia, 599 whales in the next five years, including 17 Endangered right whales); Empire Offshore Winds, 509 whales; Ocean Wind, 248 whales; TerraSond, 381 whales; Community Offshore Wind, 7,809 dolphins; Orsted Wind Power North America, 6,000 short-beaked common dolphin. There are many others.

NOAA divides these IHAs into two categories: Level A harassment results has the potential to injure or kill, while harassment at the Level B may cause changes in behavioral patterns. Most of the authorizations listed above are Level B, but many of the companies have been authorized for Level A for various species, including the endangered North Atlantic right whale.

Please note that the most common cause of death for whales on the eastern seaboard of the United States is from entanglements or vessel strikes. Level B harassment may indirectly lead to increased whale deaths by forcing them into busy shipping channels.

It is critical to note that the NOAA does not give scientific reasons to prove that Level B harassments are non-lethal or that they would not cause permanent injury.

The bipolar NOAA itself admits that humpback whale deaths along the Atlantic Coast have been unusually high since 2016, with the highest count of 37 in the year 2023 being when IHAs were more common. Similarly, NOAA has documented the unusual mortality rate of the North Atlantic right whales since 2017.

The question is why would NOAA authorize wind companies to harass and kill whales at a time of increasing deaths? And who gives NOAA permission to do so?

NOAA’s treatment of these marine mammals contrasts starkly with its institutional ethos of shielding these gentle ocean giants from peril and even demise. Instead, NOAA has seemingly embraced offshore wind farms with the unwavering resolve of climate alarmists.

Frankly, I’ve grown weary of ceaseless calls for more evidence connecting animal mortality with wind energy activities and, all the while NOAA authorizes more killing.
California Globe

Pile Driving Noise
Technical Report
Rand Acoustics, LLC
28 March 2024

Abstract
This technical report presents the methodology, analysis, and results of an independent investigation of underwater noise levels from wind turbine pile driving operations, conducted southwest of Nantucket on November 2, 2023.

Conclusions
This paper presents the methodology, analysis, and results of an independent investigation of underwater noise levels from pile driving by the crane ship Orion utilized as a pile driving vessel
in the Vineyard Wind BOEM Lease Area OCS‐A 0501 southwest of Nantucket Island, Massachusetts. The pile driving operations included double bubble curtains and hydro damper net for noise controls. Nonetheless, the survey results find pile driving impulsive sound levels are similar to seismic airgun arrays and raise concerns about heightened adverse noise impacts on
marine mammals.

  1. Peak levels measured up to 180 dB re 1uPa at 1.06 km. The calculated source level SL,pk is 241 dB with noise reduction mitigations employed. Despite double bubble curtains and hydrodamper, pile driving peak levels are comparable to seismic airgun arrays. Propagation loss was 20.1log(r), consistent with spherical spreading.
  2. NMFS relies on the RMS sound level for setting protective radii around impulsive pile driving. There are several different RMS computation methods. RMS was analyzed by applying two methods per Madsen 2005, with a 200ms window consistent with the limits of the mammalian hearing window, and a 90pct window using the 5- to 95-percent effective signal duration. The 90-percent RMS consistently underestimated by 2 to 6 dB the 200ms RMS for mammalian hearing response recommended in Madsen 2005. This disparity is consistent with the observations in Madsen 2005 and of the waveforms acquired in this survey that show lengthening with distance, increased numbers of reflections and pre-peak impulse arrivals of impulse energy through the sediment. It is concluded that at distances of 1 to 8 kilometers in waters of these depths the 90-percent RMS currently used by NMFS should not be considered a conservative metric for establishing protective radii for mammalian hearing and behavioral response.
  3. The calculated sound exposure level weighted for LF Cetacean species is 198.8 dB re 1 μPa2 s. Pile driving sound exposures of 13 minutes at 500 meters, 45 minutes at 1000 meters, or 2 hours at 1800 meters, yields a cSEL exceeding the PTS threshold (onset of permanent hearing loss). A sound exposure of 2 minutes at 1200 meters, 5 minutes at 2200 meters, and 10 minutes at 3200 meters yields a cSEL exceeding the TTS threshold (temporary threshold shift, hearing impaired). It appears PTS exposure is possible for Cetaceans at significant distances.
  4. The calculated sound exposure level weighted for PW Phocid species (seals) is 178.3 dB re 1 μPa2 s. Pile driving sound exposures of 1-3/4 hours at 100 meters yields a cSEL exceeding the Level A PTS threshold (onset of permanent hearing loss). A pile driving sound exposure of 40 minutes at 500 meters, or 2 hours at 1 kilometer, yields a cSEL exceeding the TTS threshold (temporary threshold shift, hearing impaired).
  5. Propagation loss for Weighted SEL measured 16.5log(r) and 15.5log(r) for LF and PW weightings respectively. These propagation loss constants are consistent with practical spreading. Regulators assuming spherical spreading would underestimate sound exposure levels and resulting impacts including Level B and possibly Level A Harassment. Technical Report: Pile Driving Noise Survey, November 2, 2023
  6. Level A Harassment appears feasible depending on time periods occupied at various distances to the pile driving. Further assessment using unweighted SELs (from cautions in Southall 2019) finds much larger setbacks are needed. It is unclear that the mitigation methods set in place are adequate to protect the NARW and other ESA-listed mammals and marine species.
  7. The distance to the unweighted 160 dB,rms isopleth distance for Level B Harassment is 3355 meters, using the RMS,200ms time weighting for mammalian hearing (Madsen 2005). Whereas the IHA Authorization listed a distance of 2739 meters with 12 dB reduction.
  8. The IHA Application and Authorization omit noise impact assessment for exposure at each step between SPLs of 120-140, 140-160, and 160-180 dB listed in the BOEM Offshore Wind Energy Project Biological Assessment Method 2 (Wood 2012). Whereas weighted (LF) RMS
    sound levels compared to the BOEM step table show ninety percent of mysticetes responding (avoidance response) within 1 kilometer, and fifty percent respomding out to 14.5 km.
  9. The IHA Application and Authorization did not evaluate continuous vessel propulsion, DP thruster or combined noise levels by vessel operations in the lease area. The IHA documents including the Authorization treat the Orion and support vessels as silent. Ambient sound levels without pile driving were dominated by Orion and support vessel propulsion and thruster noise including cavitation, despite double bubble curtains surrounding the Orion. Orion and support vessel sound levels with pile driving off measured 127 dB RMS re 1uPa at 0.57 NM (1.06 km) and 123 dB RMS at 3.17 NM (5.87 km) from the Orion.
  10. NMFS appears to have abandoned evaluation of its Level B behavioral harassment threshold at 120 dB,rms which leaves insufficient protections in place for marine species behavioral harassment. To meet the NMFS 120 dB,rms behavioral harassment threshold for the operation’s continuous noise only, the distance required is estimated at over 6 km.
  11. The data acquired during the survey and subsequent review of project and regulator documents raise concerns of sufficient NOAA review methods and mitigation distances to protect the critically endangered North Atlantic Right Whale (NARW) and other marine species from behavioral harassment and hearing loss impacts from pile driving.

Rand Acoustics (Full Report PDF)

via STOP THESE THINGS

https://ift.tt/vBmaesT

June 7, 2024 at 02:30AM

Natural Gas Fuels Prosperity of Canadian First Nations Communities

By Vijay Jayaraj

Obsessed with the faux climate crisis, the Canadian government in Ottawa seemingly discounts altogether the social and economic benefits of natural gas to First Nations communities of the country’s western region.

Approximately 5% of the world’s gas comes from Canada, mainly from the vast Western Canadian Sedimentary Basin underlying several provinces, including British Columbia, Alberta and Saskatchewan. In 2023, the country ranked fifth in global production behind the U.S., Russia, Iran and China.

Some First Nations communities — a designation that takes in indigenous people living south of the Arctic Circle — have historically faced challenges in terms of economic development and social well-being. Limited access to education, healthcare and infrastructure has resulted in lower living standards compared to the national average — a fact that I observed firsthand as a researcher in British Columbia. Unemployment rates are often higher in First Nations communities, and poverty remains a persistent issue.

However, oil and gas development has provided a pathway to prosperity to many of these communities. Liquified natural gas (LNG) projects, for example, require a significant workforce in both construction and operational phases. This translates into direct employment opportunities and much needed income for First Nations people otherwise lacking financial security.

The development of natural gas resources also necessitates infrastructure upgrades in nearby communities. These can include the construction or enhancements of roads, bridges and communication networks. Such improvements benefit the entire community by providing access to markets, educational opportunities and other essential services.

“For far too long, First Nations could only watch as others built generational wealth from the resources of our traditional lands” says Eva Clayton, president of the Nisga’a Lisims government. “But times are changing.”

First Nations participation in natural gas development goes beyond economic benefits. It represents an opportunity for communities to assert their self-determination and participate in shaping their own future. Communities can participate in natural gas projects through equity ownership and various arrangements, including Impact Benefit Agreements. According to the Canada Energy Centre, more than 75 First Nations and Métis communities in Alberta and British Columbia have agreed to ownership stakes in energy projects, including the Coastal GasLink pipeline and major transportation networks for oil sands production.

One such example is the recent Musqueam Partnership agreement by FortisBC, which will share the benefits of the Tilbury LNG facility’s expansion phase to begin in 2025. First Nations beneficiaries will include communities of the Snuneymuxw, T’Sou-ke, Esquimalt, Scia’new, Pacheedaht, Pauquachin, Huu-ay-aht, Kyuquot/Checleseht, Toquaht, Uchucklesaht and Ucluelet. Similarly, the Woodfibre LNG project to begin production in 2027 will directly benefit the Squamish community.

Demand for natural gas in North America and across the world should ensure increasing prosperity into the future, unless the federal government’s climate fetish undermines the industry.

Just such a possibility has prompted an alarm to be sounded by the First Nations LNG Alliance—a collective of communities supportive of LNG development in British Columbia.

“First Nations have made their choice about the LNG opportunity, informed by research and consultation,” says Karen Ogen, CEO of the LNG Alliance,

“However, when 88 environmental groups and other organizations recently demanded an end to LNG, no one bothered to talk to us,” she said. “I view that as a ‘re-colonization’ of energy by environmentalists. It’s a type of eco-colonialism that First Nations people like me are all-too familiar with, particularly as we seek to diversify our economies and provide opportunities for young people and future generations.”

Ms. Ogen’s complaint of “eco-colonialism” is not unlike the charge of “climate imperialism” that has been leveled against Western elites by leaders of the Global South who bristle at being pressured to adopt “green” agendas at the expense of actual economic development supported gas and other fossil fuels.

Indeed, the sentiments of Ms. Ogen almost certainly resonate with those who favor common sense over ideology. “Canadian LNG is Indigenous LNG, and that is good for the world and good for all of us here,” she says.

This commentary was first published at Daily Caller on June 1, 2024

Vijay Jayaraj is a Research Associate at the CO2 Coalition, Arlington, Virginia. He holds a master’s degree in environmental sciences from the University of East Anglia, U.K.

via Watts Up With That?

https://ift.tt/dGnuIsO

June 7, 2024 at 12:02AM

New Data Show Svalbard Polar Bears are Fatter than They Were in 1993 Despite Continued Low Sea Ice

From Polar Bear Science

Researchers at the Norwegian Polar Institute have finally updated their spring data, which show male polar bears in 2024 were even fatter than they were in 1993 and litter sizes of new cubs were just as high, despite continued low sea ice in the region over the summer months especially.

The region

Area surveyed in August 2015 where polar bears were found, as shown below (Aars et al. 2017) included the pack ice north of Svalbard. Spring surveys done in March/April appear to include only land areas of the Svalbard archipelago.

Sea ice conditions

This year, at the end of May around Svalbard:

In the wider area of the Barents Sea:

Unfortunately, Norwegian Ice Service data only go back to 1997, so we can’t see specifically what conditions were like in 1993, but other sources show sea ice was more extensive then in all seasons.

Hopen Island, circled on the map below, is so far south that bears are only able to den there when Barents Sea fall ice is extensive (Andersen et al. 2012; Derocher et al. 2011).

The graph below, copied from the MOSJ polar bear webpage, shows the number of days from 1979-2024 when sea ice cover around Hopen Island in the fall (1 October – 31 December) exceeded 60%. In the early 1990s, ice cover around Hopen was unusually abundant (black line). By 1994, many females used the island for maternity denning (peak of blue line) but after 2007, few if any bears did so due to lack of sea ice.

Spring 2024 Data

The newest Norwegian data show that cub recruitment (the number of cubs per litter), copied below, was as high in 2024 as it has ever been and just as high as it was in 1993 before sea ice declines began, although in 2023 it was the lowest since 1993.

Data for the body condition of male bears in spring (March-May, copied below), which has been tracked since 1993, show a slight decrease up to the year 2000.

However, after 2000, body condition increased over the next two decades to 2024 despite a significant decrease in sea ice cover, leaving bears in better condition overall in 2024 than they had been in 1993 and any year since.

Conclusions

This 2024 data from male Svalbard bears mirrors that of female bears captured up to 2017, which showed a similar pattern (Lippold et al. 2019): less sea ice in recent years has meant bears have been in better condition than they were in the 1990s when there was more sea ice.

Lippold and colleagues (2019: 988) stated this clearly for female polar bears (my bold]:

Unexpectedly, body condition of female polar bears from the Barents Sea has increased after 2005, although sea ice has retreated by 50% since the late 1990s in the area, and the length of the ice-free season has increased by over 20 weeks between 1979 and 2013. These changes are also accompanied by winter sea ice retreat that is especially pronounced in the Barents Sea compared to other Arctic areas. Despite the declining sea ice in the Barents Sea, polar bears are likely not lacking food as long as sea ice is present during their peak feeding period. Polar bears feed extensively from April to June when ringed seals have pups and are particularly vulnerable to predation, whereas the predation rate during the rest of the year is likely low.”

As I’ve explained previously, this is almost certainly due to the fact that less sea ice in summer causes increased primary productivity — more plankton feeds more fish, which feeds more seals — which produces an abundance of seals for polar bears to feed on when sea ice is present in the spring (Crockford 2023; Frey et al. 2022).

The Norwegian authors concluded their 2024 polar bear report by stating [my bold]:

Even though the loss of sea ice has been marked around Svalbard in recent years, and is expected to continue in the coming decades, the size of the subpopulation may still be below the carrying capacity.

It is therefore possible that the subpopulation currently is still growing, or at least is stable, even though the availability of habitats has become poorer for much of the year. …

Observations so far are unable to document that changes in the climate have had clear effects on the subpopulation.

References

Aars, J., Marques,T.A, Lone, K., Anderson, M., Wiig, Ø., Fløystad, I.M.B., Hagen, S.B. and Buckland, S.T. 2017. The number and distribution of polar bears in the western Barents Sea. Polar Research 36:1. 1374125. doi:10.1080/17518369.2017.1374125

Andersen, M., Derocher, A.E., Wiig, Ø. and Aars, J. 2012. Polar bear (Ursus maritimus) maternity den distribution in Svalbard, Norway. Polar Biology 35:499-508.

Crockford, S.J. 2024. State of the Polar Bear 2023. Briefing Paper 67. Global Warming Policy Foundation, London. Download pdf here.

Derocher, A.E., Andersen, M., Wiig, Ø., Aars, J. and Biuw, M. 2011. Sea ice and polar bear den ecology at Hopen Island, Svalbard. Marine Ecology Progress Series 441:273-279.

Frey, K.E., Comiso, J.C., Cooper, L.W., et al. 2022. Arctic Ocean primary productivity: the response of marine algae to climate warming and sea ice decline. 2020 Arctic Report Card. NOAA. DOI: 10.25923/Oje1-te61 https://arctic.noaa.gov/Report-Card/Report-Card-2022/Arctic-Ocean-Primary-Productivity-The-Response-of-Marine-Algae-to-Climate-Warming-and-Sea-Ice-Decline

Lippold, A., Bourgeon, S., Aars, J., Andersen, M., Polder, A., Lyche, J.L., Bytingsvik, J., Jenssen, B.M., Derocher, A.E., Welker, J.M. and Routti, H. 2019. Temporal trends of persistent organic pollutants in Barents Sea polar bears (Ursus maritimus) in relation to changes in feeding habits and body condition. Environmental Science and Technology 53(2):984-995. Get the paper here.

via Watts Up With That?

https://ift.tt/Cag5xtP

June 6, 2024 at 08:01PM

The Renewable Green Energy Disaster off the Northeastern US is Getting Worse

From NOT A LOT OF PEOPLE KNOW THAT

By Paul Homewood

h/t Paul Kolk

A slow-motion collapse in the offshore wind industry continues to grow as sticky inflation and supply chain challenges force developers to delay or cancel major projects. In particular, progress towards the Biden administration’s goal of building large amounts of floating wind off the northeastern US coast is just about stalled.

Shell, which  invested in a series of offshore wind projects in recent years, including offshore the northeastern United States, announced last week it would lay off much of its offshore wind business staff as the oil giant advances its program of refocusing on its core oil and gas business.

“We are concentrating on select markets and segments to deliver the most value for our investors and customers,” a Shell spokesperson told Bloomberg. “Shell is looking at how it can continue to compete for offshore wind projects in priority markets while maintaining our focus on performance, discipline and simplification.”

Wind turbine maker Siemens Gamesa announced even bigger layoffs, saying it would cut 15 per cent of its global staff to adjust to a slowing market. The announcement comes after the company reported a €4.6 billion loss for 2023, a losing trend that has continued over the first half of 2024…..

In light of the industry’s gloomy outlook, Westwood notes that “calls are ringing out for governments to provide more specific policy and regulatory support for technology development in addition to cost reduction and investment in port infrastructure to accelerate adoption.”

This is completely predictable, since the voracious rent-seeking wind business invariably calls for more government largesse in response to any challenge that arises. Unfortunately, the call is too often answered by policymakers who have made big political bets on being able to show off arrays of mammoth windmills floating atop various oceans and seas, intermittently producing some electricity – generally 25-30 per cent of nominal plant capacity over time.

This latest bad news for offshore wind could become especially troublesome for US President Joe Biden’s re-election campaign, since he has invested so much of his personal political capital in pushing a major buildout of floating offshore wind in the Atlantic northeast. A 2023 Department of Energy fact sheet sets the administration’s goal of installing 30 GW of offshore wind capacity by 2030 for the US alone, exceeding Westwood’s just estimated potential for global new capacity by that year by a factor of 10 times over.

To date, regulators under Biden have approved permits for 6 major offshore projects, several of which have already been delayed or cancelled by developers in response to tougher economic factors. In late 2023, major Danish wind developer Orsted cancelled two projects off the Atlantic coast, and Shell divested its 50 per cent stake in another in March of this year. Equinor and BP announced in January they were cancelling plans for their Empire Wind 2 project, citing similar economic concerns.

One US offshore project, Vineyard Wind 1, was able to begin delivering its intermittent 25-30 per cent of 68 megawatts (MW) to Massachusetts residents in January with the activation of 5 offshore turbines. The South Fork Wind Project was also able to commence first deliveries into New York in March, with 12 turbines capable of generating some proportion of 130 MW.

But this is less than one per cent of the Biden goal of 30 GW, with just five and a half years remaining until 2030. Given the wind industry’s insatiable appetite for ever-increasing subsidies and constantly rising utility charges, it’s an open question how many more billions of dollars the federal government will be allowed to print to keep projects alive before the voters start to rebel at the cost.

It’s a rebellion that could commence as soon as this coming November.

https://www.telegraph.co.uk/news/2024/06/03/renewable-energy-green-offshore-wind-disaster-biden

via Watts Up With That?

https://ift.tt/MPNzoEZ

June 6, 2024 at 04:06PM