CFACT and our allies are under attack for daring to defend right whales.
via CFACT
June 3, 2024 at 03:30AM
CFACT and our allies are under attack for daring to defend right whales.
via CFACT
June 3, 2024 at 03:30AM
By Jo Nova
A Norwegian whaler paid for 2,200 aerial photos of East Antarctica in 1937. Since then humankind has emitted 91% of all the emissions we’ve ever produced and the world is facing an extinction level catastrophe and yet satellite photos show this 2,000 kilometer long section of East Antarctica hasn’t changed — or at least, not in any way related to our uptake of coal power or planes, trains, airconditioners and cars. Basically the human race emitted 1,600 billion tons of carbon dioxide which was supposed to warm the poles twice as fast as anywhere else, but there is still nothing to see here.
Using hundreds of old aerial photographs dating back to 1937, combined with modern computer technology, the researchers have tracked the evolution of glaciers in East Antarctica. The area covers approximately 2,000 kilometers of coastline and contains as much ice as the entire Greenland Ice Sheet.
Compared to modern data, the ice flow speeds are unchanged. While some glaciers have thinned over shorter intermediate periods of 10–20 years, they have remained stable or grown slightly in the long term, indicating a system in balance.
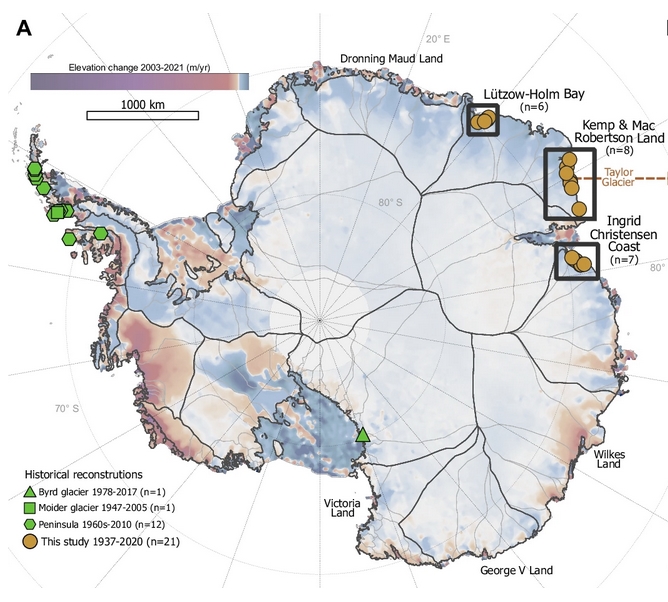
A Existing historical glacier reconstructions (Byrd11, Moider32 and Peninsula31) and glaciers included in this study (frontal reconstructions n = 21, elevation reconstructions n = 12, velocity reconstructions n = 4), overlaid on 2003–2021 Antarctic annual elevation change from Smith et al5., with MEaSUREs basin72
Imagine the fuss if these old photos showed a glacier melting?
Most of the images used in the study were captured during a 1937 expedition organized and paid for by Norwegian whaler Lars Christensen. The mission aimed to produce the first maps of this part of East Antarctica, but the maps were never published due to the German invasion of Norway. Since then, the images have been stored at the Norwegian Polar Institute in Tromsø and forgotten.
When the researchers from the University of Copenhagen read about the expedition, they realized that valuable images were likely hidden in an archive in Norway. They traveled to Tromsø and reviewed all 2,200 images taken during the expedition. They supplemented the Norwegian aerial images with images of the same glaciers from Australian surveys conducted between 1950 and 1974.
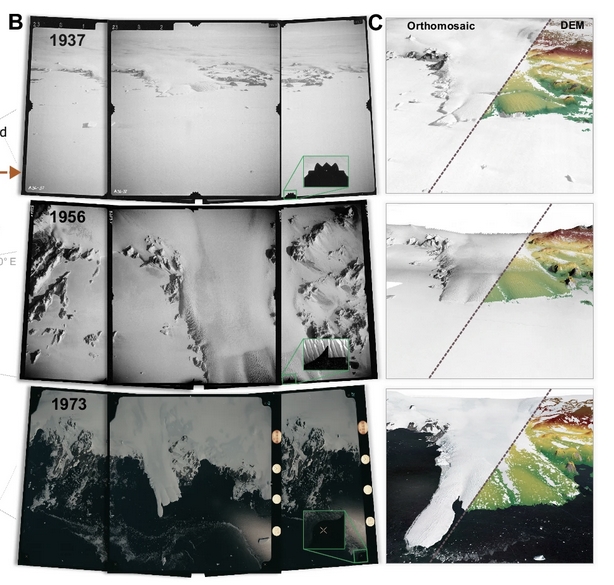
B Taylor glacier in 1937, 1956, and 1973 as captured in the aerial images. Close up shows the different types of fiducial marks used for standardizing the internal image geometry. C Produced digital elevation models (DEM) overlain on orthomosaics generated from interpolated DEMs. For the productions of the 1956 DEM and orthomosaic we included additional oblique images (not included here) as the glacier was photographed with a trimetrogon camera setup.
During the last few decades, several sectors in Antarctica have transitioned from glacial mass balance equilibrium to mass loss. In order to determine if recent trends exceed the scale of natural variability, long-term observations are vital. Here we explore the earliest, large-scale, aerial image archive of Antarctica to provide a unique record of 21 outlet glaciers along the coastline of East Antarctica since the 1930s. In Lützow-Holm Bay, our results reveal constant ice surface elevations since the 1930s, and indications of a weakening of local land-fast sea-ice conditions. Along the coastline of Kemp and Mac Robertson, and Ingrid Christensen Coast, we observe a long-term moderate thickening of the glaciers since 1937 and 1960 with periodic thinning and decadal variability. In all regions, the long-term changes in ice thickness correspond with the trends in snowfall since 1940. Our results demonstrate that the stability and growth in ice elevations observed in terrestrial basins over the past few decades are part of a trend spanning at least a century, and highlight the importance of understanding long-term changes when interpreting current dynamics.
And for those who want to see the ebb and flow (inasmuch as we have any data) here is the detailed graph of those 21 glaciers. Click to enlarge. It’s obvious that without long term data and climate models that work, (and can predict precipitation) we have no chance of predicting glacier growth or loss, and nor should we infer long term prophesies from 20 or 30 year short cycles. Even 85 years of somewhat minimal data shows there is a lot of variation, and none of it apparently related in any obvious way to man made CO2 emissions.
Mads Dømgaard et al, Early aerial expedition photos reveal 85 years of glacier growth and stability in East Antarctica, Nature Communications (2024). DOI: 10.1038/s41467-024-48886-x
0 out of 10 based on 0 rating
via JoNova
June 3, 2024 at 03:16AM

The wind industry led with its chin making wild claims about powering X million homes around-the-clock. As subsidised wind and solar undercut reliable generators (thanks to the subsidies and preferential scheduling) and ultimately knock them out of the market, the sporadic, chaotic and only occasional delivery of wind and solar becomes glaringly obvious.
Wind power generation, of course, depends entirely on the wind: too little means no power; too much, likewise means no power. It also means wind power outfits have nothing to sell. In most instances their subsidies are directly related to the amount of that they can occasionally push into the grid. Think renewable energy certificates or production tax credits.
One (rather lame) response has been to suggest that spearing thousands more of these things, far and wide, will plug the gaps when the wind drops. As the myth has it, ‘the wind is always blowing somewhere’ (a seasoned sailor would have easily put that fantasy to bed). But, in the result, adding more wind turbines has all the impact of pushing on string: a whole lot of effort, with no direct or tangible benefit.
The wind industry always talks a big game, but can never back it up. Simply because everything they might produce hinges entirely on the wind, as this report from Kevin Killough explains below.
The intermittency of wind and solar power could be worse than originally thought, experts say
Just The News
Kevin Killough
2 May 2024
Last month, multiple news outlets reported on the record-smashing year the wind industry had in 2023. The Global Wind Energy Council released its latest report showing the world installed 117 gigawatts of capacity. The Associated Press called 2023 a “record year for wind installations,” and Reuters noted that the U.S. was among the top five markets for wind installations.
The U.S. Energy Information Administration released a report this week showing that installing more wind farms doesn’t necessarily mean generating more electricity. The U.S. tripled its wind energy capacity, according to the report, from 47 gigawatts in 2010 to 147.5 gigawatts at the end of 2023. While that may sound impressive, generation from all those wind farms dropped 2.1% over 2022.
Much of that drop was during the first six months of 2023, when wind generation fell by 14% compared to the same period in 2022.
The capacity factor for the nation’s wind energy fleet, the EIA explained in its report, dropped to an eight-year low of 33.5%. This is the ratio of the amount of power produced compared to the total it could have produced if it were running continuously.
Fairly common
Renewable energy has an intermittency problem, which is why even though it’s cheap while it’s producing electricity, it’s more expensive than any other form of energy due to all the costs associated with making it reliable. These extra costs include the costs of battery facilities, baseload backup generators, transmission lines and over building of capacity.
However, as the drop in wind generation in 2023 shows, even with wind farms spread out across the U.S., it’s still possible that the wind won’t be there to turn the turbines. These wind lulls are called wind droughts.
“Wind droughts can happen at any time and are fairly common. As regions of the country become more reliant upon wind turbines producing electricity during periods of high demand, they become more prone to electricity shortages during these wind droughts,” energy experts Isaac Orr and Mitch Rolling, write in an article on their “Energy Bad Boys” Substack.
Orr and Rolling, who are policy fellows for the Center of the American Experiment, produced a report in 2022 showing how a 15-state region experienced a “wind drought” lasting more than three days. Science Magazine describes wind droughts as “prolonged periods of low wind speeds,” which “pose challenges for electricity systems largely reliant on wind generation.”
The Midcontinent Independent System Operator, an organization tasked with managing the flow of high-voltage electricity across that region, produced less than 10% of its potential 22 gigawatt wind output over an 82-hour period. For 42 hours straight within that period, the wind output was only 1.5% of the total. Fortunately, coal and natural gas were available to meet demand.
Energy droughts
A new study by researchers at the Pacific Northwest National Laboratory (PNNL) found that some parts of the country experience energy droughts lasting a week. Energy droughts are when both wind and solar energy fail as a result of windless, cloudy days.
The researchers found that energy droughts can occur in any season across the lower 48 states, and they vary widely in frequency and duration. California, for example, experienced energy droughts lasting several days, whereas Texas experienced frequent energy droughts lasting a few hours. The study also discovered that these energy droughts happen at the worst times.
“We found that the severity of the droughts that happened during those periods of high load is higher than the severity on average during periods that are not during high load,” Dr. Cameron Bracken, lead author of the study and Earth scientist at PNNL, told Just The News.
The study standardized its findings so that other researchers could use the same tools to and make accurate comparisons across different studies. The PNNL researchers hope their study will provide insight into designing and managing energy storage.
The study wasn’t able to look at what was happening with other energy sources — hydroelectric, coal, gas and nuclear facilities — during these drought events, Bracken said.
“That information is really difficult to come by. It’s usually proprietary,” Bracken said. That means, they can’t really determine during any particular drought event they identified what the exact shortfall that occurred on the grid was.
Orr and Rollin, in their analysis of the 2022 MISO drought event, were looking at the impact to grid reliability in Minnesota as a result of decreasing dispatchable generation from coal.
“The problem isn’t that the wind stops blowing sometimes; the issue is that state carbon-free electricity mandates and federal regulations are pushing reliable, dispatchable power plants into retirement,” the duo wrote.
That rate of retirement is likely to increase as a result of the EPA’s new power plant rules released late last month, which require expensive carbon-capture technologies in new gas plants and existing coal plants. The added costs, experts say, may make retirement a more attractive option for the plant owners.
Should that happen, the best hope for maintaining stability as the grid relies more and more on intermittent wind and solar will be battery facilities.
Dr. Ariel Cohen, senior fellow at The Atlantic Council, in testimony he submitted for a Senate Budget Committee hearing Wednesday, explained that storage costs of lithium-ion batteries amount to $338 per kilowatt hour for a battery with a 10-hour storage duration. For comparison, the average retail price of electricity in the U.S. is 12.36 cents per kilowatt hour. A single day of storage in the U.S., according to Cohen, would cost approximately $3.7 trillion per day.
If energy droughts hit American consumers when they need power the most while the grid depends on increasing amounts of batteries to satisfy demand, electricity is going to get a lot more expensive.
Just The News

via STOP THESE THINGS
June 3, 2024 at 02:33AM
“A key problem with the ‘All of the Above’ policy is that it purposefully bypasses the scientific assessment part. Why? Because lobbyists are acutely aware that their clients’ energy products will fail such an evaluation.”
The fundamental fight over enacting effective energy policies is between lobbyists and the public. (A parallel perspective is that it is a contest between real Science and political science.)
Lobbyists are paid to represent their clients’ economic interests or political agendas. The public consists of citizens, businesses, and the military.
Lobbyists are professionals who spend most of their time soliciting legislators on their client’s behalf. See the The Wolves of K Street: The Secret History of How Big Money Took Over Big Government.
The obvious question is: Who is balancing out this one-sided influence by competently and aggressively representing the public’s interests on energy policies (and other important issues)? The unfortunate answer is almost no one.
The result of this striking imbalance is that most energy policies are essentially written by lobbyists — which means they are permeated with benefits for their clients, and then conveyed with carefully orchestrated marketing propaganda.
To keep their control, lobbyists full well know that they must maintain the impression that their self-serving policies are actually in the public interest — so they leave no stone unturned to creatively maintain that illusion.
Despite lobbyists’ carefully massaged messages, it is totally accidental if any parts of their policies actually happen to be advantageous to the public. A classic example of this is the well-known “All of the Above” energy mantra.
This is saying that ALL energy sources should not only be allowed on the Grid but should also be supported. On the surface (especially to non-technical parties) it sounds reasonable, as who wouldn’t be in favor of investigating alternative energy options?
However, allowing an energy source on the Grid is a privilege, not an entitlement! Sound energy policies (i.e., those that would actually benefit the public) would ensure that the only energy alternatives that are permitted on the Grid would be those that have scientific proof that they are a net societal benefit.
Phrased another way, that would mean the only alternative energy sources that should be approved and supported are those that are: a) reliable, b) low cost, and c) environmentally friendly. [Note: Wind and solar are none of these!]
How do we do that? Well, it’s certainly not by taking a salesperson’s (lobbyist’s) word about their product! We assess the real qualifications of proposed alternative energy sources by conducting a scientific assessment.
A key problem with the “All of the Above” policy is that it purposefully bypasses the scientific assessment part… Why? Because lobbyists are acutely aware that their clients’ energy products will fail such an evaluation.
To avoid that exposé, they devised a clever end-run around the facts: no scientific assessment is needed if all options are pre-approved as acceptable!
If we buy the lobbyists’ energy mantra, we accept everything. These marketers have cleverly switched the focus from the actual merits of alternative energy sources, to such subjective intangibles as energy “diversity” and “security”…
On the surface, the “All of the Above” slogan sounds innocent enough and even has a ring of reasonableness to it. But, of course, that is the lobbyists’ raison d’etre: to subtly get preferential treatment for third-rate energy sources that otherwise would fall by the wayside.
We need to do some critical thinking about lobbyists’ sales pitches. In this example: does an “All of the Above” policy really make sense?
#1 – When we include ALL options, that would mean that unreliable alternative sources of energy would be put on the Grid.
#2 – When we include ALL options, that would mean very expensive alternative sources of energy would be put on the Grid.
#3 – When we include ALL options, that would mean environmentally destructive alternative sources of energy would be put on the Grid.
Do ANY of those make sense? How do we advance our economy and our society, by allowing unreliable, expensive, and environmentally ruinous alternative power sources on the Grid?
This is a 100% predictable result when political science replaces real Science.
Conclusion
Who benefits from an “All of the Above” energy policy? It certainly is not taxpayers, ratepayers, most businesses, the military, or the environment. Major beneficiaries would be foreign conglomerates who supply us with inferior energy sources, our enemies who are anxious to see our Grid and economy crippled, plus China to whom we will owe an even larger debt.
There is a BETTER path, and one that is in the public’s best interest…
An “All of the Sensible” energy slogan would go a LONG way towards putting some balance in the energy policy fight, plus it would send the message that citizens, businesses, and the environment are a top priority for legislators.
What are our “sensible” energy choices? Well, that is exactly the conversation we should be having. I would posit that “sensible” alternative electrical energy sources are those that are proven to have a net societal benefit — so let the discussion begin!
————–
This post originally appeared at Critically Thinking About Select Societal Issues.
The post “All of the Above” — Bad Energy Policy appeared first on Master Resource.
via Master Resource
June 3, 2024 at 01:16AM