Guest “Wind & Solar No Shows… Again” by David Middleton
JUNE 21, 2024
Data source: U.S. Energy Information Administration, Wholesale Electricity Market Portal Note: Data on demand by region lags total demand. ISO-NE=Independent System Operator of New England
Electricity demand in New England surged this week as high temperatures persisted through much of the United States.
Demand in the electric grid territory of New England’s Independent System Operator (ISO-NE) peaked at 23,324 megawatts (MW) during the evening of June 20, approaching last year’s peak hourly demand in this region. The June 20 peak around 7:00 p.m. eastern time was 521 MW above the June 19 peak demand of 22,803 MW, around 6:00 p.m. ISO-NE expects less demand over the weekend and into early next week as temperatures cool.
Peak electricity demand on both June 19 and 20 were a bit less than the 24,553 MW of peak hourly demand forecast in ISO-NE’s summer assessment issued on June 3, 2024. Hourly demand for electricity in ISO-NE for 2023 peaked at 24,043 MW. To meet the demand, utilities in New England burned more natural gas. Natural gas burned in the power sector in ISO-NE reached nearly 2.0 billion cubic feet (Bcf) on both June 19 and 20, according to S&P Global Commodity Insights, compared to about 1.20 Bcf per day consumed on the Wednesday and Thursday of the previous week.
Other regions are also experiencing increased electricity demand. Electricity demand in the PJM Interconnection, which covers a large region from New Jersey to Illinois, peaked at 145,892 MW on June 20, about the same amount as demand on June 19. In its Summer 2024 Reliability Assessment, PJM forecasted peak hourly demand for the season reaching 151,000 MW.
We track hourly electricity market data in our Wholesale Electricity Market Portal, where users can examine and access electricity markets data for the seven Regional Transmission Organizations (RTO) and ISOs. The portal also includes information on power generation type, regional temperatures, and wholesale pricing. Our New England Dashboard also includes information on the region’s natural gas and petroleum markets.
Principal contributors: Mark Morey, Chris Peterson
Another Ice Age?
TIME
JUNE 24, 1974 12:00 AM EDT
In Africa, drought continues for the sixth consecutive year, adding terribly to the toll of famine victims. During 1972 record rains in parts of the U.S., Pakistan and Japan caused some of the worst flooding in centuries. In Canada’s wheat belt, a particularly chilly and rainy spring has delayed planting and may well bring a disappointingly small harvest. Rainy Britain, on the other hand, has suffered from uncharacteristic dry spells the past few springs. A series of unusually cold winters has gripped the American Far West, while New England and northern Europe have recently experienced the mildest winters within anyone’s recollection.
As they review the bizarre and unpredictable weather pattern of the past several years, a growing number of scientists are beginning to suspect that many seemingly contradictory meteorological fluctuations are actually part of a global climatic upheaval. However widely the weather varies from place to place and time to time, when meteorologists take an average of temperatures around the globe they find that the atmosphere has been growing gradually cooler for the past three decades. The trend shows no indication of reversing. Climatological Cassandras are becoming increasingly apprehensive, for the weather aberrations they are studying may be the harbinger of another ice age.
(See photos of how scientists are trying to keep Africa’s deserts at bay.)
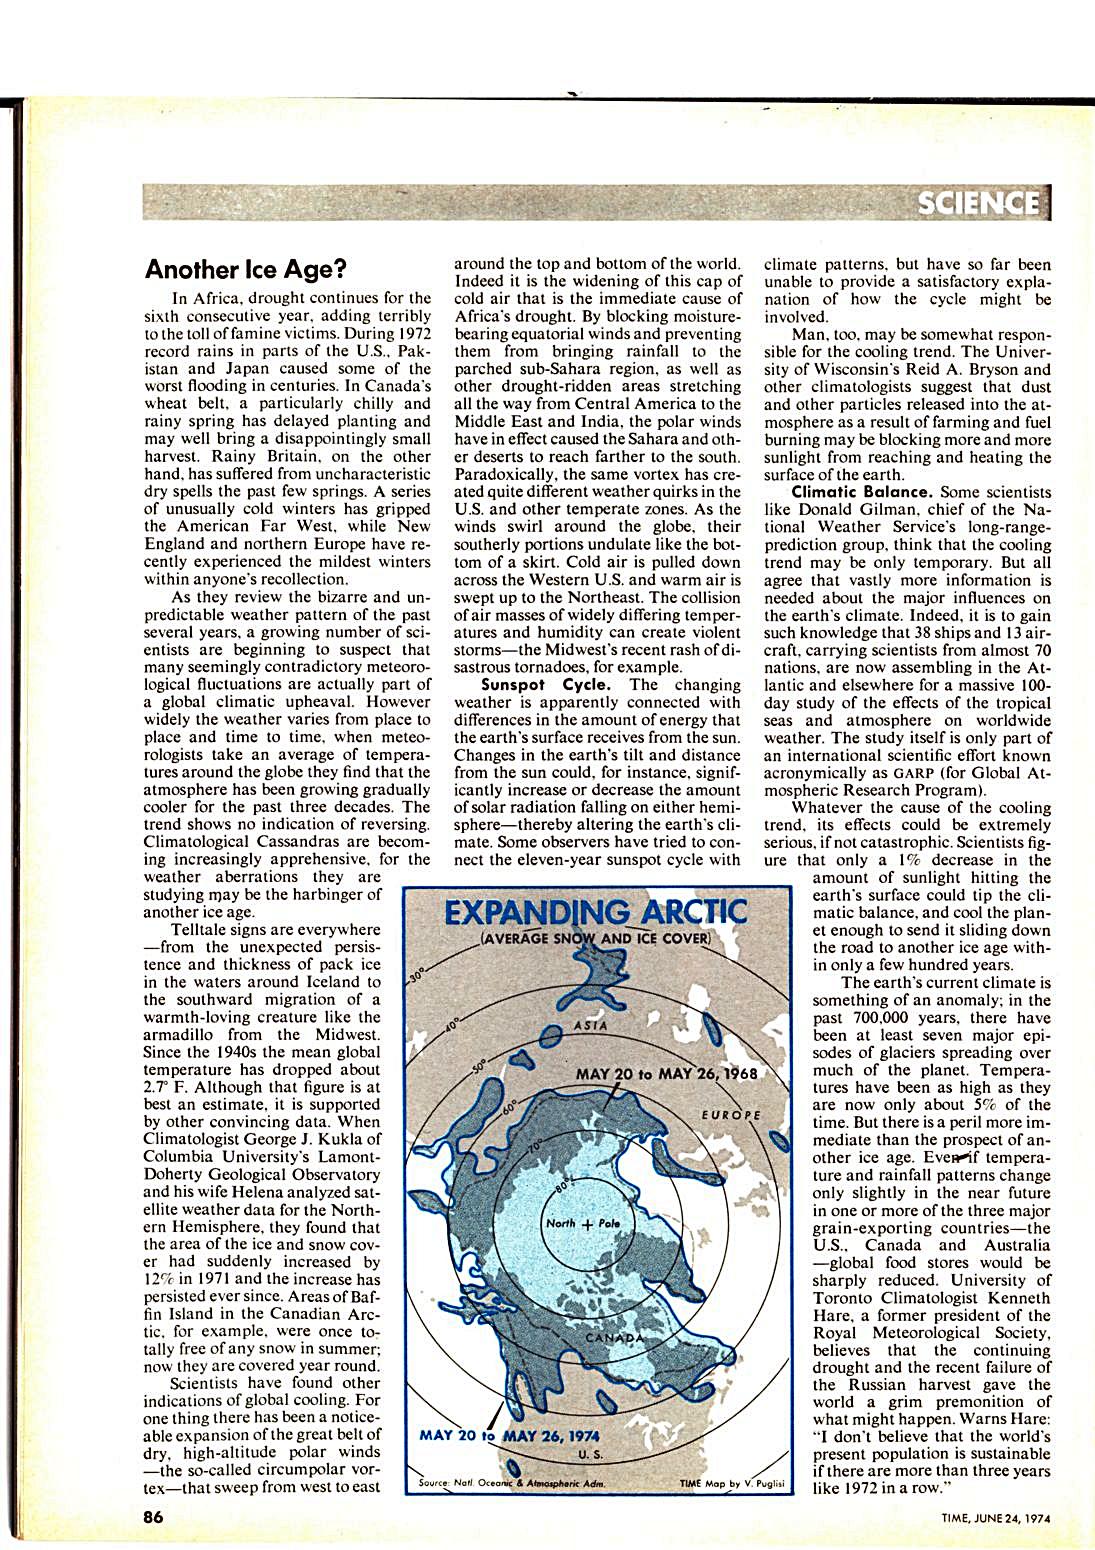
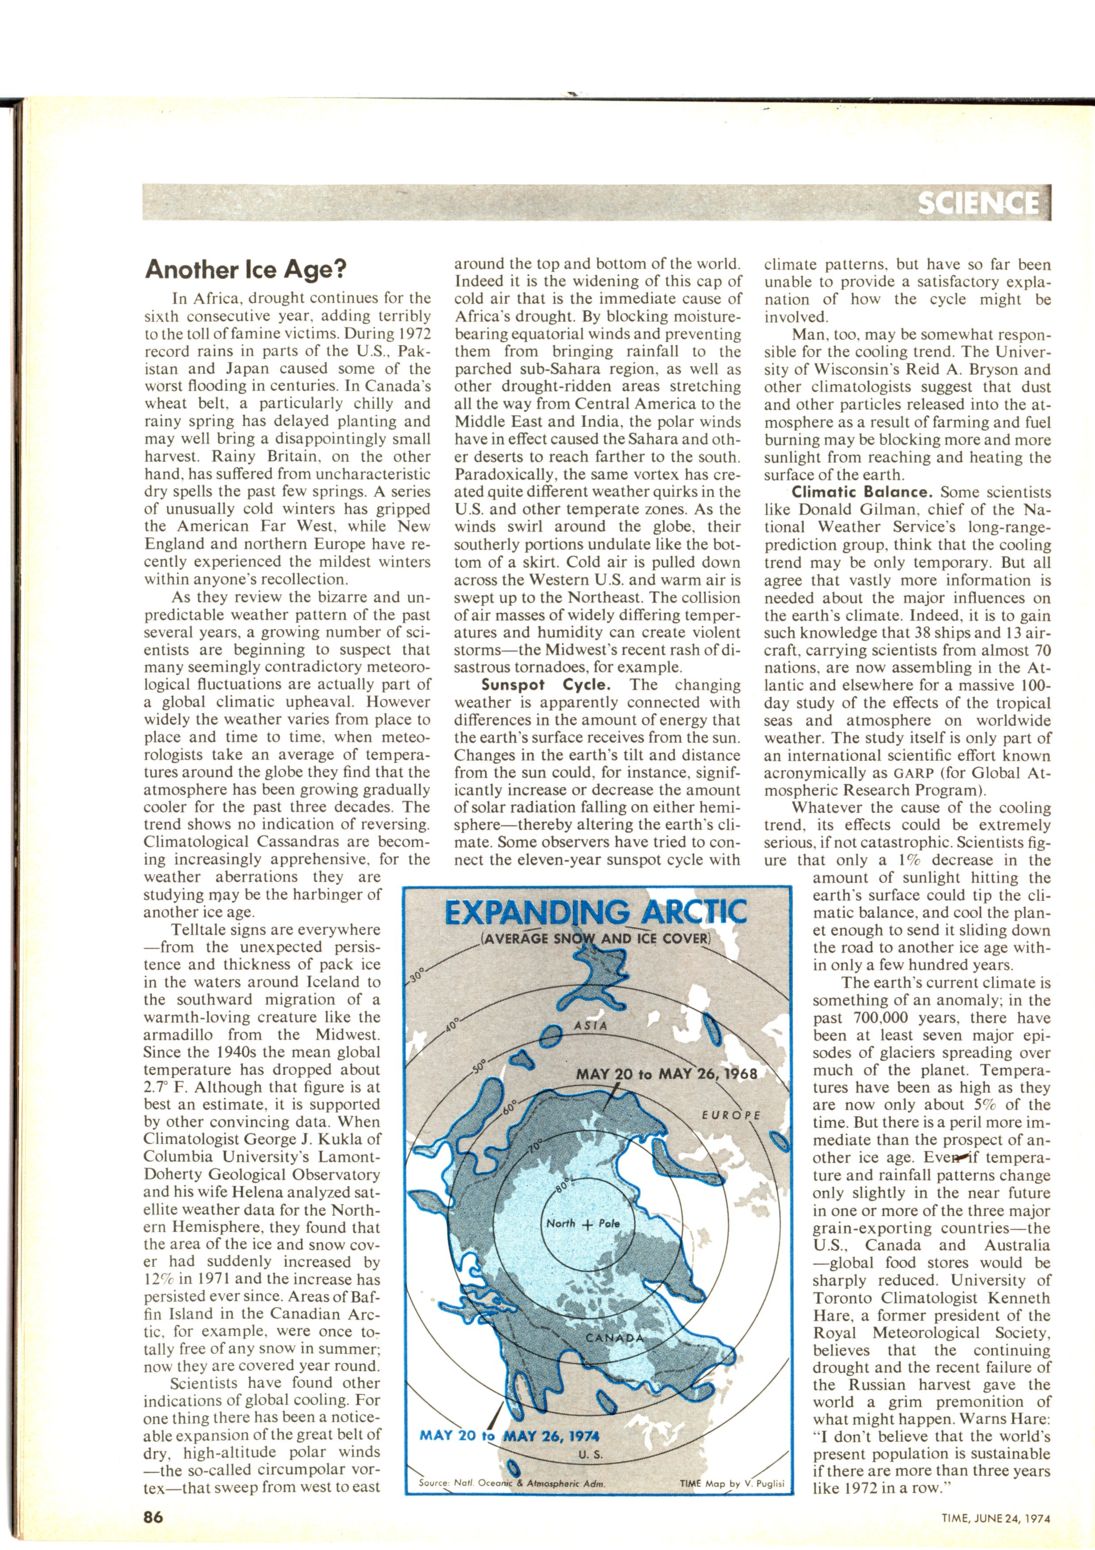
Telltale signs are everywhere — from the unexpected persistence and thickness of pack ice in the waters around Iceland to the southward migration of a warmth-loving creature like the armadillo from the Midwest.Since the 1940s the mean global temperature has dropped about 2.7F. Although that figure is at best an estimate, it is supported by other convincing data. When Climatologist George J. Kukla of Columbia University’s Lamont-Doherty Geological Observatory and his wife Helena analyzed satellite weather data for the Northern Hemisphere, they found that the area of the ice and snow cover had suddenly increased by 12% in 1971 and the increase has persisted ever since. Areas of Baffin Island in the Canadian Arctic, for example, were once totally free of any snow in summer; now they are covered year round.
(See a video on the history of climate change.)
Scientists have found other indications of global cooling. For one thing there has been a noticeable expansion of the great belt of dry, high-altitude polar winds — the so-called circumpolar vortex—that sweep from west to east around the top and bottom of the world. Indeed it is the widening of this cap of cold air that is the immediate cause of Africa’s drought. By blocking moisture-bearing equatorial winds and preventing them from bringing rainfall to the parched sub-Sahara region, as well as other drought-ridden areas stretching all the way from Central America to the Middle East and India, the polar winds have in effect caused the Sahara and other deserts to reach farther to the south. Paradoxically, the same vortex has created quite different weather quirks in the U.S. and other temperate zones. As the winds swirl around the globe, their southerly portions undulate like the bottom of a skirt. Cold air is pulled down across the Western U.S. and warm air is swept up to the Northeast. The collision of air masses of widely differing temperatures and humidity can create violent storms – the Midwest’s recent rash of disastrous tornadoes, for example.
Sunspot Cycle.
The changing weather is apparently connected with differences in the amount of energy that the earth’s surface receives from the sun. Changes in the earth’s tilt and distance from the sun could, for instance, significantly increase or decrease the amount of solar radiation falling on either hemisphere thereby altering the earth’s climate. Some observers have tried to connect the eleven-year sunspot cycle with climate patterns, but have so far been unable to provide a satisfactory explanation of how the cycle might be involved.
Man, too, may be somewhat responsible for the cooling trend. The University of Wisconsin’s Reid A. Bryson and other climatologists suggest that dust and other particles released into the atmosphere as a result of farming and fuel burning may be blocking more and more sunlight from reaching and heating the surface of the earth.
Climatic Balance. Some scientists like Donald Oilman, chief of the National Weather Service’s long-range-prediction group, think that the cooling trend may be only temporary. But all agree that vastly more information is needed about the major influences on the earth’s climate. Indeed, it is to gain such knowledge that 38 ships and 13 aircraft, carrying scientists from almost 70 nations, are now assembling in the Atlantic and elsewhere for a massive 100-day study of the effects of the tropical seas and atmosphere on worldwide weather. The study itself is only part of an international scientific effort known acronymically as GARP (for Global Atmospheric Research Program).
Whatever the cause of the cooling trend, its effects could be extremely serious, if not catastrophic. Scientists figure that only a 1% decrease in the amount of sunlight hitting the earth’s surface could tip the climatic balance, and cool the planet enough to send it sliding down the road to another ice age within only a few hundred years.
The earth’s current climate is something of an anomaly; in the past 700,000 years, there have been at least seven major episodes of glaciers spreading over much of the planet. Temperatures have been as high as they are now only about 5% of the time. But there is a peril more immediate than the prospect of another ice age. Even if temperature and rainfall patterns change only slightly in the near future in one or more of the three major grain-exporting countries — the U.S., Canada and Australia — global food stores would be sharply reduced. University of Toronto Climatologist Kenneth Hare, a former president of the Royal Meteorological Society, believes that the continuing drought and the recent failure of the Russian harvest gave the world a grim premonition of what might happen. Warns Hare: “I don’t believe that the world’s present population is sustainable if there are more than three years like 1972 in a row.”
These 9 charts from the Statistical Review Of World Energy expose the myth of the energy transition & show hydrocarbons are growing faster than alt-energy
Global energy use in 2023 hit a new record, 620 EJ, of which about 81.5% came from hydrocarbons. Image: Energy Institute.
During his 16-year career in the NBA, Rasheed Wallace was among basketball’s most intimidating power forwards. He was also among the most volatile. Wallace holds the single-season record for technical fouls (41) and ranks third all-time in total technicals with 317.
In addition to his disdain for referees, the 6’11” Wallace, gained fame for a particular catchphrase. If “Sheed” or one of his teammates was called for a foul that he thought was undeserved, and the opposing player missed the ensuing free throw, he would often holler, “Ball don’t lie,” to indicate that the basketball knew the referee had made a bad call.
Amid the ongoing blizzard of propaganda about the “energy transition” and the tired antics of the goobers from Just Stop Oil — a pair of whom vandalized Stonehenge with orange paint last Wednesday — the Statistical Review, published by the Energy Institute, KPMG, and Kearney, provides a much-needed reality check to the narrative being promoted by major media outlets, academics, and the NGO-corporate-industrial-climate complex.
Rasheed Wallace on the verge of getting another technical foul in 2008. Photo: Wikipedia.
The new Statistical Review, released last Thursday, shows, yet again, that despite the hype, subsidies, and mandates, wind and solar energy aren’t keeping pace with the growth in hydrocarbons. Global hydrocarbon use and CO2 emissions hit record highs in 2023, with hydrocarbon consumption up 1.5% to 504 exajoules (EJ). That increase was “driven by coal, up 1.6%, [and] oil up 2% to above 100 million barrels [per day] for the first time.” Global natural gas demand was flat, mainly due to stunning declines in Europe. Gas demand in the U.K. fell by 10%. It also fell by 11% in Spain, 10% in Italy, and 11% in France.
Soaring electricity demand was, yet again, the big story in 2023. Global power generation increased by 2.5% to 29,924 terawatt-hours. About 32% of that juice (9,456 TWh) was generated in China, where electricity production surged by nearly 7%. The U.S. came in a distant second in power generated, with 4,494 TWh. Domestic power production dropped by about 1% last year. Power generation in India also increased by about 7% last year to a record 1,958 TWh, 75% of which came from coal-fired power plants.
I look forward to the release of the Statistical Review every year because the data can be downloaded in Excel. That allows me and others to make meaningful comparisons beyond the spin. Numerical comparisons are essential ingredients in the debate over energy and climate policy. The best advice I ever got on presenting numbers came from author and statistician Edward Tufte. He said: whenever you give people a number, give them a familiar metric so they can make a comparison. That advice changed the course of my career. Here are nine charts from the Statistical Review.
This graphic uses the same numbers as the one in the previous slide but has higher resolution because the numbers can be compared more easily. It clearly shows that the reductions in emissions in the West are being swamped by the massive increases in China and India.
Chart 5
The U.S. again led the world in emissions reductions in 2023, but as shown in the previous two slides, those reductions are being swamped by the growth in India and China.
Chart 6
Climate activists can sling all the soup and paint they want, but oil remains the dominant form of energy consumed worldwide. Oil use increased slightly last year in the U.S., up about 0.5%. Meanwhile, consumption soared in China, up almost 11%. It was also up 5% in India and nearly 13% in Vietnam. The results: global demand jumped by about 2.3 million barrels per day, and oil use averaged over 100 million barrels per day for the first time in history.
Chart 7
As I noted last December in “Two Days After COP28, IEA Delivers More Coal Hard Reality,” the International Energy Agency has been predicting a decline in global coal demand for years. I explained that in 2015, the IEA claimed, ‘The golden age of coal in China seems to be over.” That year, the agency predicted global coal demand would fall to 5.5 billion tons by 2020. That didn’t happen. Instead of falling, coal demand keeps powering upward, with major increases in China and India. Other Asian countries, including Vietnam, the Philippines, and Bangladesh, are also burning more coal.
Chart 8
The Inflation Reduction Act provides tens of billions of dollars in subsidies for wind and solar in the U.S. However, as seen below, gas-fired generation is still growing faster than those two sources combined. Note that in 2023, wind generation fell despite the addition of 6 gigawatts of capacity. Why? The wind didn’t blow.
Chart 9
We are carpet bombed with claims that alt-energy — and solar in particular — is cheaper than other forms of electricity production. And yet, in China and India, coal-fired generation continues to grow faster than solar. Maybe they didn’t get the memo.
I will continue pulling numbers from the Statistical Review until June 2025, when the next edition is published. And I will repeat here a line I use in my speaking engagements: These aren’t my numbers. These are the numbers.
And the numbers don’t lie.
Alliance for Responsible Citizenship Podcast on Energy Poverty Is Out
On Friday, the Alliance for Responsible Citizenship published the podcast I moderated last year in London with Magatte Wade, Chris Wright, and Scott Tinker. The caption for the conversation: “What is Energy Poverty Actually Like?” Magatte, Chris, and Scott all brought sharp perspectives to the table, and they all emphasized what should be obvious: the world’s poorest people need hydrocarbons, and lots of them, to climb out of poverty. You may watch it by clicking here.


