

In a recent short video (below) John Burgess summarizes why wind farms become unviable long before promoters promised. He explains that after about 15 years wind farms are uneconomic to keep going. Also the far more reliable older smaller under 2 MW turbines have a longer life. All based on the work of one professor – Gordon Hughes.who did some brilliant work on wind farm costs some three years ago. For those preferring to read, I provide a transcript lightly edited from closed captions in italics with my bolds, key exhibits and added images.
Paul Burgess Basics 2 The Lifespan of Wind Turbines
This video is on the lifespan of wind turbines. In this video and quite a few others actually, I’m going to be relying on the work of Professor Gordon Hughes and a document you should all read is this one The link to Hughes’ study is in the title in red below. That video was produced three years ago but had very few views less than a thousand. My job is to bring these stories to the public and his work is extremely valuable, so this video is based on that.
![]()
Wind Power Economics – Rhetoric and Reality
Here we go the lifespan of turbines shock horror. Wind turbines gradually wear out and they do
it faster than you think. As I have explained, the load factor for a wind farm is the percentage of the actual electricity you get out of it in the real world compared to a purely theoretical maximum, the maximum being every second of the Year it blows perfectly and everything you get 100%. What percentage of that do we actually get, that’s the load factor.
Typically for onshore wind farms in the UK Island Etc it’s 26 to 30%, in that sort of range. The bigger ones, the higher ones may get into the low30s. So that’s the load Factor but that doesn’t stay the same. It actually deteriorates. These things wear out as they go, and they actually deteriorate at quite a rate, around about 3% per year. And so what matters with load factors– no excuses. If it has to be stopped for maintenance that reduces a load Factor, because it’s a real world measurement of what you produce.

Now Denmark kept really good records of their turbines. And here is a diagram that explains a few things about them. The results are quite remarkable. This graph looks complicated, but it’s a graph to show basically the failure rate over time for wind turbines. And it’s constructed from a large number of wind turbines in Denmark. On this vertical axis is how much of the energy is lost, which affects the load factors. We start off with almost zero so nothing is lost. We’re getting the expected performance, and that seems to be the case here for almost two years. But as you go up that axis and you go to the very top, there’s nothing left at all, There’s no energy output.
Now there are four colors of Curves, The higher two are for offshore, showing Old Generation and New Generation offshore. The lower two are for onshore, again Old Generation and New Generation. The new generation have higher turbine values and this comprises turbines up to 8 megawatts. They’re much worse than the older generation; they deteriorate much faster, and you can see that from the curves. Reading a curve is quite amazing. Let’s look at what point you’ve lost 60% of the energy coming out the wind farm. For Offshore New Generation the answer there is just 60 months or 5 years.
So 60% of those offshore modern turbines have failed within 5 years. Obviously they have to repair them all the time and therefore there’s a big rising cost to all this. But looking quickly at what we get from onshore modern ones which is the orange curve here. Let’s check when 20% of the turbines are failed, that’s one out of five turbines, and that is at about 68 months or about 5 to six years.
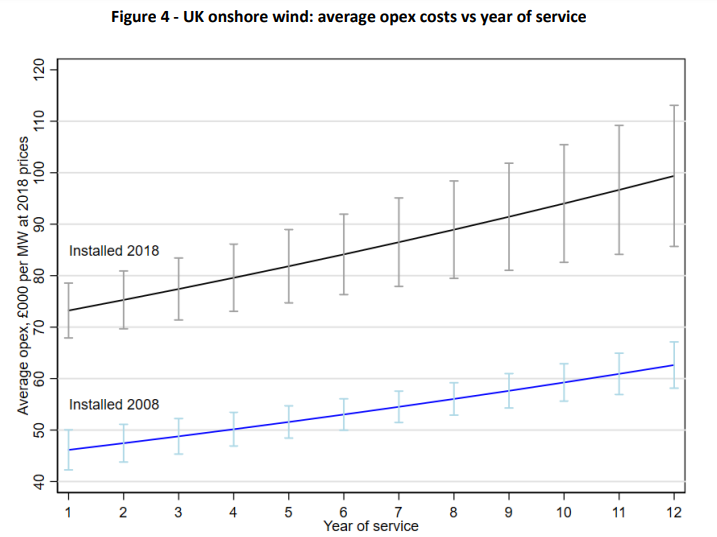
You can expect failures so these things they had to be repaired, which puts the costs up. So what are the running costs of these turbines? This graph of one axis shows how many thousands of pounds per megawatt of installed capacity you actually pay out per year. And the bottom scale is the length of time, how much those costs rise over time. And as you can see the lower line is the older generation and the Top Line the newer generation, such as they are putting into the Isle of Man
So let’s take Isle of Man as an example. They’re going to install 20 megawatts worth, so let’s look at the running cost and these are in 2018 prices, so the costs have risen since then. You can see taking the Isle of Man modern turbines we start off at £74,000 a year per megawatt, and we end at about £100,000 a year after 12 years per megawatt of installed capacity. So we start off with 74 times in this case for 20 megawatts for the Isle of Man which is 1.48 million a year and we end up at a neat 2 million a year in running costs. And that keeps rising.
This basically shows that after about 15 years
it’s no longer worth maintaining the wind Farm.
Offshore wind of course is much more expensive starting off at around about £200,000 a year and ending up at £400,000 a year per megawatt, three to four times the price of onshore.

I am aware that that raises lots of questions and they will be answered in following videos. Why is it if it’s about 15 years that you’ve had some forms carry on Beyond? And so on. The whole thing seems to me to be a Ponzi scheme, it really does. And that will be explained in following videos.

via Science Matters
August 21, 2024 at 10:16AM
