
Rising sea levels is one of the biggest scare stories in the climate alarmists play book, even though it has been debunked so many times. Here it is again:
via climate science
August 30, 2024 at 01:37AM
Rising sea levels is one of the biggest scare stories in the climate alarmists play book, even though it has been debunked so many times. Here it is again:
via climate science
August 30, 2024 at 01:37AM
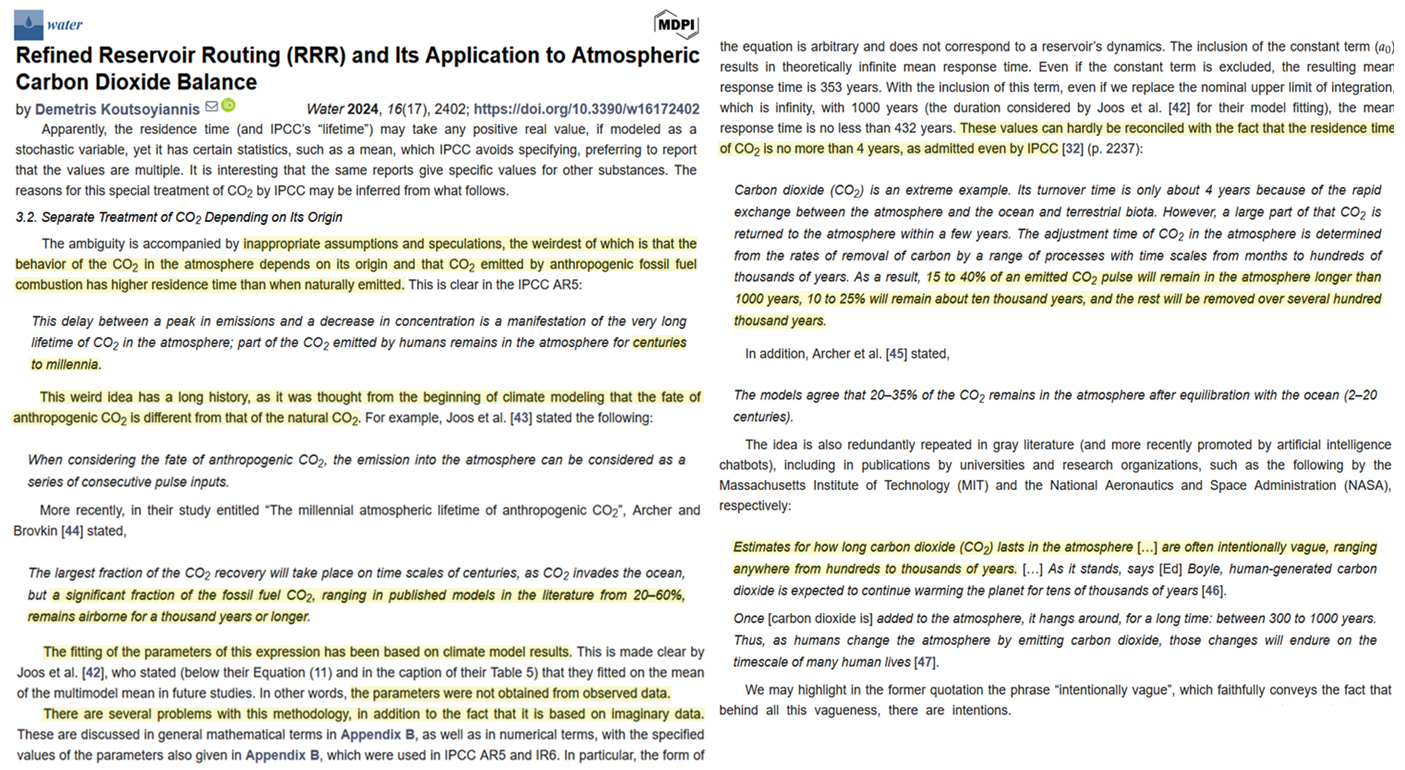
Per a new study, the Intergovernmental Panel on Climate Change (IPCC) utilizes “inappropriate assumption and speculation,” as well as non-real-world models of “imaginary data,” to claim CO2 emissions derived from fossil fuel burning function “weirdly,” far differently in the atmosphere than CO2 molecules derived from natural emissions (e.g., plant respiration, ocean outgassing) do.
“The ambiguity is accompanied by inappropriate assumptions and speculations, the weirdest of which is that the behavior of the CO2 in the atmosphere depends on its origin and that CO2 emitted by anthropogenic fossil fuel combustion has higher residence time than when naturally emitted.”
While the IPCC acknowledges emissions from natural sources have an atmospheric residence time of only 4 years, they have simultaneously constructed model outputs that assert CO2 molecules derived from fossil fuel emissions remain in the atmosphere for hundreds, thousands, tens of thousands, even several one hundred thousands of years.
Per the IPCC:
“15 to 40% of an emitted CO2 pulse [from anthropogenic emissions] will remain in the atmosphere longer than 1000 years, 10 to 25% will remain about ten thousand years, and the rest will be removed over several hundred thousand years.”
“Carbon dioxide (CO2) is an extreme example, its turnover time is only about 4 years because of the rapid exchange between the atmosphere and the ocean.”
Again, a four-year residence time for natural CO2, but hundreds of thousands of years residence time for CO2 molecules elicited from fossil fuel burning. It would seem just about any result can be derived from imaginary data.
Instead of relying on models built on assumption and speculation, Dr. Koutsoyiannis utilizes a well-established, hydrology-based theoretical framework (refined reservoir routing, or RRR) combined with real-world CO2 observations to robustly conclude the residence time for all CO2 molecules, regardless of origin, is between 3.5 and 4 years.
The applied theoretical results match the empirical results so closely (e.g., an empirical mean of 3.91 years vs. a theoretical mean of 3.94 years at Barrow, and an identical 3.68 years for both empirical and theoretical means at Mauna Loa from 1958-2023) that the theoretical framework can be said to be “close to perfect.” In other words, the consistency of the applied calculation with real-world observations provides robust evidence that CO2 residence time is likely close to this range.
In contrast, the calculated probability for the modeled, imaginary-data-based claim that the residence time for a CO2 molecule persists for over 1000 years is 10⁻⁶⁸, which means the probability value is “no different from an impossibility.”
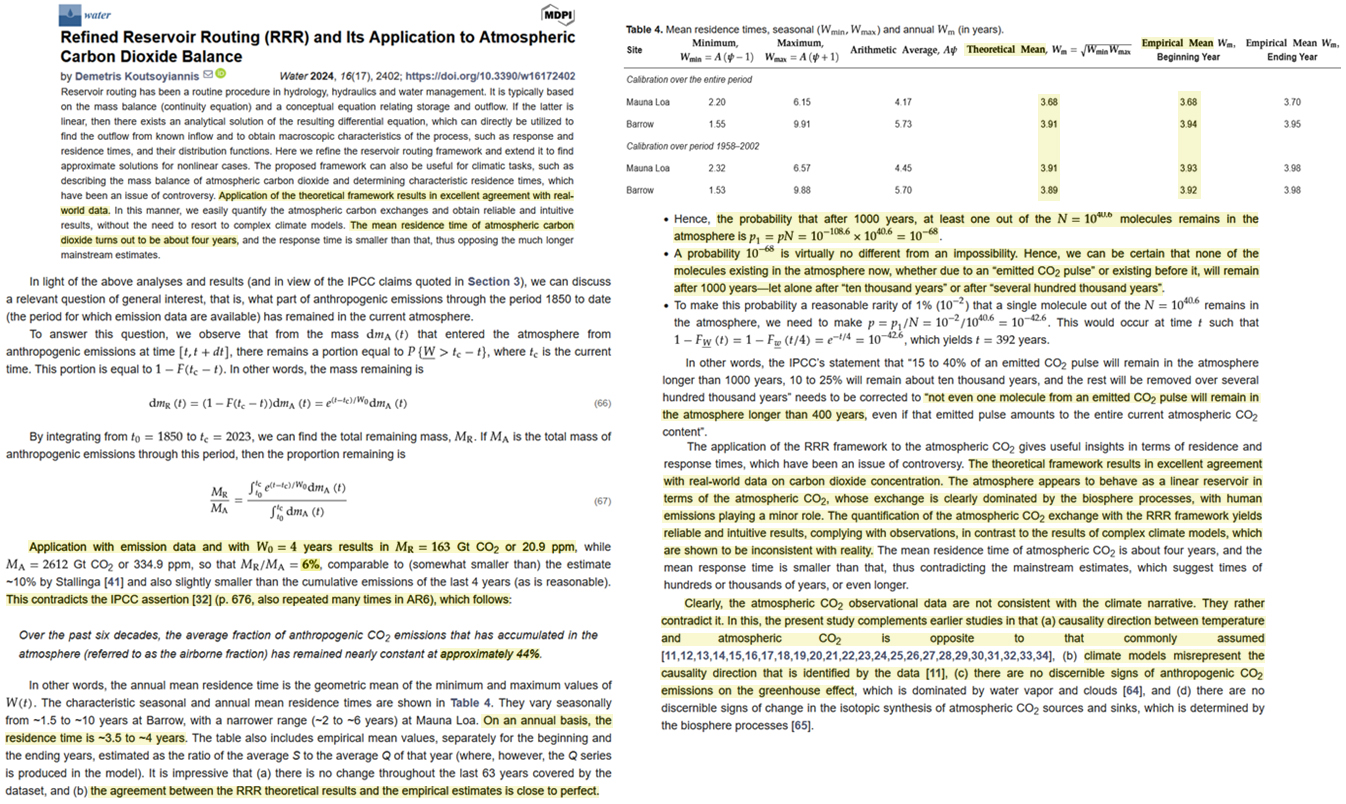
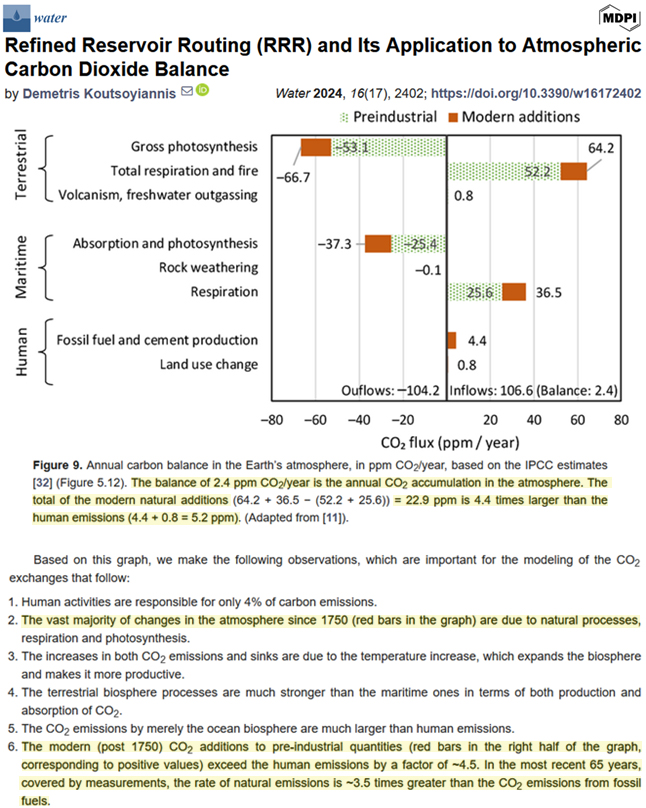
A residence time of only 4 years for all CO2 molecules, regardless of origin, is consistent with the conclusion that nature is dominant in driving changes in CO2 concentration. Fossil fuel emissions serve only a minor role.
Since 1750, additions to the atmospheric CO2 concentration derived from natural emission sources associated with biological processes are about 4.5 times larger than the contribution from fossil fuel emissions (e.g., 22.9 ppm per year from nature, 5.2 ppm per year from fossil fuel combustion).
In other words, observed CO2 data contradict the climate narrative that says anthropogenic fossil fuel burning is driving CO2 concentration changes.
via NoTricksZone
August 30, 2024 at 12:27AM
By Bill Peacock
“If Americans want to keep their gasoline-powered cars and their large refrigerators … be able to afford travel across their states and country … avoid European—and California—style energy poverty, their only hope is to convince politicians to end subsidies for renewables and all other forms of energy.”
It is common for advocates of renewable energy to complain about the subsidies given to fossil fuels. “We have heard testimony,” stated U.S. Senator Sheldon Whitehouse, “about the threat climate change poses to entire sectors of our economy.”
So, what are we, the federal government, doing to protect against these threats? Actually, we are subsidizing the danger. As we’ll hear today, the United States subsidizes the fossil fuel industry with taxpayer dollars.
Joining Sen. Whitehouse in this vein are groups like the International Monetary Fund, The Future is Electric, and the Natural Resources Defense Council.
Exaggerations
The amount of fossil fuel subsidies is very exaggerated. Whitehouse claims the U.S. subsidies in 2022 alone were $20 billion. The IMF estimated the amount earlier at $660 billion (for 2020). As the multi-year totals show in Figure 1, these claims are not accurate.
Source: Bennett, et al; U.S. Joint Committee on Taxation 2019 & 2023; U.S. EIA; Congressional Budget Office
Perhaps these claims are efforts to distract from massive renewable energy subsidies that are driving the “energy transition” from fossil fuels to renewables. As seen above, renewables received $74 billion from the U.S. government in 2010–19. They are expected to increase to $244 billion from 2020 to 2029.
The subsidies are the only reason that wind and solar generation exist on the U.S. grid at commercial scale. And are the primary reason that the U.S. grid is experiencing increasingly unsustainable levels of unreliability. The subsidies also represent a takeover of the U.S. electric grid by the federal government, following in the footsteps of the takeovers of Wall Street, health care, and education.
If Americans want to keep their gasoline-powered cars and their large refrigerators, if they want to be able to afford travel across their states and country, if they want to avoid European—and California—style energy poverty, their only hope is to convince politicians to end subsidies for renewables and all other forms of energy.
Rapid Growth of Renewable Subsidies
Energy subsidies from the U.S. government come in three forms: tax expenditures, direct expenditures, and research and development expenditures. Though the proportions vary based on the energy type, the vast majority of federal energy subsidies are in the form of tax expenditures, or tax credits.
The U.S. Energy Information Administration calculated each form of subsidy for each fuel source for the years 2016 to 2022. Figure 2 shows that for the seven-year period covered in the EIA report, renewable subsidies were more than three times greater than subsidies for fossil fuels: $83.8 billion to $25.8 billion. This relationship of the subsidies in the EIA report is reflected in our research.
Source: U.S. Energy Information Administration
As seen in Figure 1, Bennett, et al. found that from 2010 to 2019, renewable energy subsidies were more than double the subsidies for fossil fuels, $74.1 billion to $37.9 billion. Today that gap is widening. From 2020 through 2029, subsidies for renewables are projected to be $244.9 billion compared to $22.5 billion for fossil fuels. Federal subsidies for fossil fuels have decreased by 40%, while renewable subsidies are up by 230%.
Source: Congressional Budget Office and the U.S. Joint Committee on Taxation
While renewable subsidies increased from 2010 through 2022, their growth exploded after the passage of the Inflation Reduction Act, signed by President Joe Biden on August 16, 2022. Figure 3 shows that before the IRA became law, wind and solar generation subsidies from 2023 to 2029 were projected to total $66 billion. After the IRA, they are projected to total $174.8 billion. But this likely underestimates the level of subsidies. The original CBO estimates we use for 2028-29 have proven in earlier years to vastly understate actual costs. These increases in renewable subsidies contrast with the estimated decline in subsidies for fossil fuels over the same period (Figure 1).
The Takeover of the U.S. Electric Grid
The push for increased renewable subsidies in the IRA marked perhaps the final stage in the U.S. government’s 30-year effort to take over the U.S. electric grid. The effect the subsidies have had on the decisions made by investors in energy markets highlight the government’s success. The success is predicated on the fact that renewable energy subsidies are not only larger than subsidies for thermal generation in absolute terms but even larger on a per unit of electricity generated (Figure 4).
Source: Bennett, et al
This points to the significant effect that renewable subsidies have on the profits of renewable energy generators. IBISWorld estimates that U.S. wind generators will receive $49.7 billion in revenue this year, with another $19.5 billion flowing to solar generators. At a combined $69.2 billion, this means the estimated $21 billion in federal wind and solar subsidies for 2024 will increase the return on investment for generators by 30% above what they earn for selling electricity. Generators in Texas, the nation’s leading generator of electricity from renewables, have experienced a similar boost. In 2018 federal and state subsidies for renewables totaled $2.5 billion. That added an additional 28.8% to Texas’ renewable generators bottom line above their revenue from sales.
These taxpayer-funded, government-guaranteed returns are the reason that renewable generation is swamping the U.S. electric grid and pushing investment in reliable thermal generation to the side. Investment in renewables grew from $29.4 billion in 2010 to $55.4 billion in 2019 as investors chased subsidized profits. An increase in renewable generation has predictably followed. In 2014, renewable generation totaled 279,242 gigawatt hours, only 6.8% of all electricity generated. By last year, renewable generation had increased 135% to 653,663 gigawatt hours. This equaled 15.6% of total generation. Meanwhile, generation from non-renewable sources fell by 7.6%.
Texas is also experiencing a renewable takeover. ERCOT, which manages about 90% of the Texas grid, forecasts renewable generation will increase by 58,654 megawatts through 2029 (wind by 3,628 megawatts, solar by 36,868 megawatts, and batteries, which also receive billions in subsidies, by 18,158 megawatts). Thermal resources, however, will only increase by 1,074 megawatts. Renewables are projected to make up 98.2% of new generation on the Texas grid over the next five years.
Ohio is another state that is going through the energy transition. The Solar Energy Industries Association reports that commercial solar facilities in Ohio have 2,822 megawatts installed, an increase of 1,300 megawatts from last year. Ohio ranks 15th in the nation for installed solar generation, up from 32nd from 2023. And farther ahead than Texas or Ohio is the renewable takeover in California. Wind and solar now make up 45.6% of in-state generation, far ahead of thermal generation’s 33.6%. Most of the rest comes from hydroelectric generation.
The Cost of the Energy Transition
The shift to renewables has come at great cost to Americans. In California, for instance, wholesale electricity prices were the highest in the nation last year at $67 per megawatt hour. Residential prices in California are also the highest at 34.3 cents per kilowatt hour, more than double the national average of 16.4 cents. Texas is not far behind. Residential prices are up 27% since 2021, though at 14.7 cents still well behind California.
But wholesale prices are a different matter. Wholesale prices last year were just behind California’s at $65. If Texas keeps that up, residential price hikes will follow. In Ohio, the cost of installing solar has reached $3.7 billion, a heavy price for generation facilities that are operational for less than half the day. Residential prices in Ohio are up 40% over the last decade, to 16.6 cents. The high cost of renewables extends to all Americans. Renewable subsidies are expected to cost taxpayers $318 billion from 2010 through 2029 (see Figure 1). The average annual cost from 2023 to 2029 will be about $30 billion.
The increased cost of electricity is not confined to price and tax hikes. The reliability of the U.S. grid is also taking a beating. It is a well-known fact that the reliability value of renewable energy declines as its grid penetration increases. This should not be surprising given the fact that renewables can only generate electricity when the sun is shining or the wind is blowing. This “intermittent” nature of renewables imposes a great burden on grid reliability. Texas, with its Winter Storm Uri blackouts, is the current poster child for what renewables can do grid reliability, but California is no stranger to this. Reliability costs, however, go well beyond the economic costs of blackouts (estimated to be between $80 billion to $130 billion in Texas for Uri). Over the last 10 years, Texas politicians and regulators have forced consumers and taxpayers to pony up on average about $5.8 billion a year as they try to incentivize new natural gas-fired generation that can come online when renewables fail. And the reliability problems caused by a reliance on renewables are responsible for California’s sky high electricity prices.
Conclusion
When politicians take over markets, bad things happen. Costs increase, consumer choices are thwarted, and well-connected businesses get rich off taxpayers. We see all these things happening in the U.S. energy transition from fossil fuels to renewables. The only way to eliminate these and other harms is to let the market work and eliminate all energy subsidies—federal and state—in America.
—————————–
Bill Peacock is the policy director of the Energy Alliance. The Energy Alliance (www.theenergyalliance.com) is a project of the Texas Business Coalition to raise awareness of issues about the energy market that matter the most to consumers: Reliability, Affordability, and Efficiency.
via Watts Up With That?
August 30, 2024 at 12:09AM
CFACT once again brought fresh water to an impoverished village in India.
via CFACT
August 29, 2024 at 11:07PM
