Month: November 2024

11 US states sue BlackRock, StateStreet and Vanguard for working as a cartel to reduce coal and increase electricity prices

BlackRock, Vanguard, State Street.

By Jo Nova

A strike at the heart of the Blob

Texas and 10 other US States have pressed the radioactive Antitrust legal button and filed against BlackRock, Vanguard and State Street. The states claim the money managers bought up large stakes in coal companies and then colluded to promote ESG and DEI (diversity, equity and inclusion) goals that reduced coal output. The decreased supply of coal, in turn increased the cost of electricity to consumers. It was fundamentally anti-competitive behaviour. These three companies together have $26 Trillion dollars of assets under management. That’s only one trillion smaller than the entire US GDP.

In this case, some of the collusion was all out in the open. The three money managers said they were trying to save the world and protect the people, and they joined groups like the GFANZ and Net Zero alliances like Climate Action 100+. But in the end, these three financial giants had collectively acquired close to 30% of most US Coal companies, and even though they claimed to have good intentions, the 11 State Attorney Generals argue that any supposed social benefits are irrelevant. These three companies have profited immensely while customers have been denied access to a free and open market, and have paid higher electricity bills.

In a democracy, the people are supposed to decide the policies, not the Oligarchs.

Look at the grip the three supermassive money managers had on the coal industry:

US Anti-trust suit.

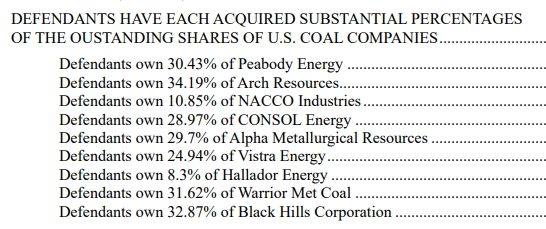
No wonder coal companies were so pathetic at fighting back against the climate propaganda.

The defendants were accused of exploiting their market power and involvement in climate advocacy groups to pressure coal companies to slash output and reduce carbon emissions from coal by more than 50% by 2030, driving up consumers’ utility bills.

“Competitive markets — not the dictates of far-flung asset managers — should determine the price Americans pay for electricity,” the states said in the complaint.

Texas Attorney General Ken Paxton, whose office filed the lawsuit, in a statement accused the defendants of promoting an “illegal weaponization of the financial industry in service of a destructive, politicized ‘environmental’ agenda.”

The lawsuit aims to stop these companies from voting on shareholder resolutions or acting in a way to undermine coal output and competition. The Attorney Generals also want money — calling for fines to be paid for the antitrust violation.

The free market has been destroyed:

For the past four years, America’s coal producers have been responding not to the price signals of the free market, but to the commands of Larry Fink, BlackRock’s Chairman and CEO, and his fellow asset managers. As demand for the electricity Americans need to heat their homes and power their businesses has gone up, the supply of the coal used to generate that electricity has been artificially depressed—and the price has skyrocketed. Defendants have reaped the rewards of higher returns, higher fees, and higher profits, while American consumers have paid the price in higher utility bills and higher costs.

The three financial giants have violated the Clayton Act (Antitrust legislation)

Defendants are three of the largest institutional investors in the world. Each Defendant has individually acquired substantial stockholdings in every significant publicly held coal producer in the United States. Each has thereby acquired the power to influence the policies of these competing companies and bring about a substantial lessening of competition in the markets for coal. And each has used its power to affect a substantial reduction in competition in coal markets. Considered alone and in isolation, each Defendant’s acquisition and use of  producers has violated Section 7 of the Clayton Act.

… Defendants have immense influence over these companies on their own, but collectively Defendants possess a power to coerce management that is all but irresistible.

They have made their goals public

But Defendants have not just acted alone and in isolation. In 2021, they went further. In that year, Defendants each publicly announced their commitment to use their shares to pressure the management of all the portfolio companies in which they held assets to align with netzero goals. Those goals included reducing carbon emissions from coal by over 50%. Rather than individually wield their shareholdings to reduce coal output, therefore, Defendants effectively formed a syndicate and agreed to use their collective holdings of publicly traded coal companies to induce industry-wide output reductions.

And even though they have pulled out of these Net zero alliances, that doesn’t change the fact that they did engage in anticompetitive behaviour and continue to threaten the free market.

Pretending to save the world while profiting from collusion is not OK

Defendants have publicly defended their anticompetitive scheme with appeals to environmental stewardship. But acquiring shares of common stock, “the effect of which ‘may be substantially to lessen competition’ is not saved because, on some ultimate reckoning of social or economic debits and credits, it may be deemed beneficial.” … The nation’s antitrust laws “reflect a legislative judgment that ultimately competition will produce not only lower prices, but also better goods and services.” … Defendants’ belief that concern for the climate confers a license to suppress competition is “mistaken.

The antitrust laws don’t permit [the enforcers of America’s antitrust laws] to turn a blind eye to an illegal deal just because the parties commit to some unrelated social benefit.”1 Under the antitrust laws, full and open competition must dictate domestic coal production.

BlackRock has also deceived its own shareholders

In addition to joining with the other two major institutional asset managers to bring about a reduction in the output of coal, Defendant BlackRock went further—actively deceiving investors about the nature of its funds. Rather than inform investors that it would use their shareholdings to advance climate goals, BlackRock consistently and uniformly represented its non-ESG funds would be dedicated solely to enhancing shareholder value. But as detailed below, BlackRock routinely violated its pledge to investors, using all its holdings to advance its climate goals and—as most relevant here—promote the objectives of its output-reduction syndicate.

The States that may save us all are Texas, Alabama, Arkansas, Indiana, Iowa, Kansas, Missouri, Montana, Nebraska, West Virginia, and Wyoming.

Other countries should be following suit, and looking hard at their own competition laws. We may not have antitrust laws, but most of the West have some kind of competition laws against cartels who misuse their market power.


0 out of 10 based on 0 rating

via JoNova

https://ift.tt/jMirJDx

November 29, 2024 at 03:32PM

“Scientists Tell Us”

“Scientists tell us we have a 10-year window — if even that — before catastrophic climate change becomes inevitable and irreversible

Scientists project that the Arctic will be ice-free in the summer of 2013. Not in 2050, but four years from now.

Scientists now warn that the Himalayan glaciers which supply fresh water to a billion people in the region could disappear completely by 2035.”

John Kerry    Oct 16, 2009

We Can’t Ignore the Security Threat from Climate Change | HuffPost Impact

About Tony Heller

Just having fun

This entry was posted in Uncategorized. Bookmark the permalink.

via Real Climate Science

https://ift.tt/ykse2JT

November 29, 2024 at 12:16PM

More ‘Settled’ Climate Science

From the University of East Anglia and the “has anyone told Al Gore?” department comes this finding that speaks to the huge complexity of Earth’s atmosphere and it’s systems.

Oceans emit sulfur and cool the climate more than previously thought.

Researchers have quantified for the first time the global emissions of a sulfur gas produced by marine life, revealing it cools the climate more than previously thought, especially over the Southern Ocean.

The study, published in the journal Science Advances, shows that the oceans not only capture and redistribute the sun’s heat, but produce gases that make particles with immediate climatic effects, for example through the brightening of clouds that reflect this heat.

It broadens the climatic impact of marine sulfur because it adds a new compound, methanethiol, that had previously gone unnoticed. Researchers only detected the gas recently, because it used to be notoriously hard to measure and earlier work focussed on warmer oceans, whereas the polar oceans are the emission hotspots.

The research was led by a team of scientists from the Institute of Marine Sciences (ICM-CSIC) and the Blas Cabrera Institute of Physical Chemistry (IQF-CSIC) in Spain. They included Dr Charel Wohl, previously at ICM-CSIC and now at the University of East Anglia (UEA) in the UK.

Their findings represent a major advance on one of the most groundbreaking theories proposed 40 years ago about the role of the ocean in regulating the Earth’s climate.

This suggested that microscopic plankton living on the surface of the seas produce sulfur in the form of a gas, dimethyl sulphide, that once in the atmosphere, oxidizes and forms small particles called aerosols.

Aerosols reflect part of the solar radiation back into space and therefore reduce the heat retained by the Earth. Their cooling effect is magnified when they become involved in making clouds, with an effect opposite to, but of the same magnitude as, that of the well-known warming greenhouse gases, such as carbon dioxide or methane.

The researchers argue that this new work improves our understanding of how the climate of the planet is regulated by adding a previously overlooked component and illustrates the crucial importance of sulfur aerosols. They also highlight the magnitude of the impact of human activity on the climate and that the planet will continue to warm if no action is taken.

Dr Wohl, of UEA’s Centre for Ocean and Atmospheric Sciences and one of the lead authors, said: “This is the climatic element with the greatest cooling capacity, but also the least understood. We knew methanethiol was coming out of the ocean, but we had no idea about how much and where. We also did not know it had such an impact on climate.

“Climate models have greatly overestimated the solar radiation actually reaching the Southern Ocean, largely because they are not capable of correctly simulating clouds. The work done here partially closes the longstanding knowledge gap between models and observations.”

With this discovery, scientists can now represent the climate more accurately in models that are used to make predictions of +1.5 ºC or +2 ºC warming, a huge contribution to policy making.

“Until now we thought that the oceans emitted sulfur into the atmosphere only in the form of dimethyl sulphide, a residue of plankton that is mainly responsible for the evocative smell of shellfish,” said Dr Martí Galí, a researcher at the ICM-CSIC and another of the main study authors.

Dr Wohl added: “Today, thanks to the evolution of measurement techniques, we know that plankton also emit methanethiol, and we have found a way to quantify, on a global scale, where, when and in what quantity this emission occurs.

“Knowing the emissions of this compound will help us to more accurately represent clouds over the Southern Ocean and calculate more realistically their cooling effect.”

The researchers gathered all the available measurements of methanethiol in seawater, added those they had made in the Southern Ocean and the Mediterranean coast, and statistically related them to seawater temperature, obtained from satellites.

This allowed them to conclude that, annually and on a global average, methanethiol increases known marine sulfur emissions by 25%.

“It may not seem like much, but methanethiol is more efficient at oxidising and forming aerosols than dimethyl sulfide and, therefore, its climate impact is magnified,” said co-lead Dr Julián Villamayor, a researcher at IQF-CSIC.

The team also incorporated the marine emissions of methanethiol into a state-of-the-art climate model to assess their effects on the planet’s radiation balance.

It showed the impacts are much more visible in the Southern Hemisphere, where there is more ocean and less human activity, and therefore the presence of sulfur from the burning of fossil fuels is lower.

The work was supported by funding from organisations including the European Research Council and Spanish Ministry of Science and Innovation.

‘Marine emissions of methanethiol increase aerosol cooling in the Southern Ocean’, Charel Wohl, Julián Villamayor and Martí Galí et al, is published in Science Advances on November 27.


via Watts Up With That?

https://ift.tt/DWraQ26

November 29, 2024 at 12:04PM

Power all of Earth just with photovoltaics and batteries?

When my previous post was almost finished, I came across a video excerpt of a Wall Street Journal interview of Elon Musk. It seems to me that this short video presented his answer to some question on nuclear fusion:

[Elon Musk]
I think we already have a giant fusion reaction in the sky that is called the sun that shows up every day. It converts four and a half million tons of mass to energy every second and requires no maintenance. It is amazing. You don’t have to refuel it, you don’t have to maintain it, it’s just there. So my recommendation for fusion is solar power and batteries. And we can easily power all of Earth just with photovoltaics and batteries. I mean, not easily, but there’s just a very clear path to do so. And no miracles require, just work.
[Thorold Barker, WSJ]
Interesting.
[Elon Musk]
I am also an advocate of wind and of nuclear fission, geothermal, hydro and what not.

Basically, solar and batteries could power the entire world with no miracles required. I can surely understand the reasoning. The sun radiates out a massive amount of energy and I think there are some places where solar supported by batteries would make sense. That is however not the case everywhere. For example, solar is out of phase with demand at our latitude (and above) and these regions would therefore need seasonal storage. Solving that would not be straightforward. That is why I didn’t even do the effort to include solar electricity production in the comparison that I made in previous post.

I don’t know whether Musk actually entertained this idea or just said it proverbially, but it got me curious about how solar would fare when added to the comparison that I made in previous post.

The technique that I used in previous post to compare wind and solar plus wind comes down to tweaking the storage capacity until it would not draw empty over an entire year, meaning just enough storage to prevent blackouts. The idea was to find the smallest storage capacity that is needed in order to have something in storage at all times.
I will use the same set of assumptions that I used in previous post in this comparison:

  • Belgian production and demand data from 2023
  • A energy production of 1.5 times demand and 3.4 times demand
  • The energy production would preferably be used directly
  • Surplus production will be put into storage with a charging efficiency of 90%
  • When there is a shortage, storage will fill in the difference with a discharging efficiency of 90%
  • Surplus production will be curtailed when storage is full.

Let’s just jump in. This is how an uninterrupted production of 1.5 times demand would look like (from left to right: solar, wind, solar plus wind):

Chart27d: production of 1.5x demand: Overview Base

That doesn’t seem to be right at first glance. All three graphs show the exact same amount of production, but there seems to be a lot more solar production in that first graph. That is however not the case and this has to do with the resolution of these graphs. Let’s zoom in strongly and look at the details of the first week of the year:

Chart27d: production of 1.5x demand: Details Base

Solar energy is exactly zero at night and, on average, there is no sun during roughly half of the year. The only way to still have the same production is going upwards between the gaps, especially at end of spring/summer/beginning autumn. That is why it seems that there is a lot more solar. One needs to enlarge that solar graph quite a lot to see what is happening, but that means not having an overview anymore, let alone comparing what is happening in those three graphs.

Everything above the blue line (demand) will or be put in storage or will be curtailed (when storage is full). Let’s have a peek at what is in storage over the year:

Chart27d: production of 1.5x demand: Overview Storage

The storage requirement for solar is a whopping 21,250 GWh, which is waaaaaay larger than wind alone (5,000 GWh) or solar plus wind (1,900 GWh).

Another difference is that wind as well as solar plus wind are able to start from empty storage, but this is not possible for solar. There is not much solar electricity produced at the start of the year and this is also the period with the highest demand, so it would not be possible to get enough electricity in storage until the time of the year when solar production is ramping up. A 9,250 GWh head start ensures that storage doesn’t draw empty before that time (beginning of February).

In order to have the same production as wind and solar plus wind, I will also end with the same amount in storage. This will also ensure that there is enough in storage at the end of the year to get over the start of the following year.

This is what will be curtailed in the three scenarios:

Chart27d: production of 1.5x demand: Overview Curtailed

Looking at those graphs, it seems that solar has much more curtailment than wind, but just as seen in the first figure of this post, that is again due to the resolution. The curtailment happens only during the sunniest hours of the day and for the rest of the day there isn’t curtailment. It would be necessary to blow up the graph in order to see that, but then there wouldn’t be an overview anymore.

Wind is more spread over the year, but more concentrated at the beginning and the end of the year. Solar plus wind show the most curtailment of the three scenarios.

Here are the numbers:

Let’s do the same for a production of 3.4 times demand. This is how uninterrupted production would look like:

Chart27d: production of 3.4x demand: Overview Base

Which has the same pattern as at 1.5 times demand, but has a much wider dynamic range (solar electricity production is between 0 and 220 at 3.4x demand compared to between 0 and 100 at 1.5x demand)

Everything above the blue line will be or stored or curtailed. This is what will be stored in the three scenarios:

Chart27d: production of 3.4x demand: Overview Storage

Solar storage capacity (9,250 GWh) is now much lower than at 1.5 times demand (21,250 GWh), but again it is much higher than wind alone (1,550 GWh) or solar plus wind (500 GWh). There is much more direct use of the production, but this means much more curtailment and over a longer time span:

Chart27d: production of 3.4x demand: Overview Curtailed

Here are the numbers:

Production of 1.5 times demand
Parameter Solar Wind Solar + Wind
Demand 2023 (GWh) 78,866.65
Demand x 1.5 (GWh) 118,299.97
Simulated production (GWh) 118,299.97
Initial in storage (GWh) 9,250 0 0
Maximum storage (GWh) 21,250 5,000 1,900
Curtailed (GWh)
(Relative to production)
28,699.78
(24%)
28,677.27
(24%)
33,511.58
(28%)
Conversion losses (GWh) 10,762.83 5,756.06 4,021.74

Solar has slightly less curtailment than wind or solar plus wind at a production of 3.4 times demand, but that difference doesn’t mean much when about 70% of production needs to be curtailed.

Concluding. Solar has some serious drawbacks compared to wind and to solar plus wind. It has zero production during on average half of the year (at our latitude there is roughly 8 hours of sunshine per day in winter, roughly 8 hours darkness per day in summer and everything in between for the rest of the year), therefore it has higher peaks for the same production. It is also out of phase with demand at our latitude (more production when demand is low and vice versa). This will lead to a much larger storage capacity requirement in order to bridge that seasonal gap.

I can however see solar supported by batteries somehow working in regions with not much seasonal differences and where solar is more in sync with demand. However, looking at the scenarios above, it seems that quite some issues need to be resolved first to get solar working in countries with large seasonal differences. For example (in no particular order):

  • Having a shitload of batteries to back up solar. But then, can enough materials be mined in order to produce the required amount of batteries?
  • Be fine with (lots of) curtailment. But then, can a different incentive structure be made to make this profitable?
  • Develop and incentivize systems that can handle intermittency, that just work when electricity is available and aren’t bothered when it is not available.
  • Building interconnections over huge distances.

These are considerable challenges, so I am curious what he exactly meant by the statement that there is a “very clear path” to power all of Earth just with photovoltaics and batteries.

The last sentence in which he also advocates for other power sources, even some conventional ones like nuclear energy, makes much more sense to m. I also think the energy landscape needs to be diverse and nuclear should not be excluded. Electricity production should certainly not be limited to intermittent power sources.

Solar (and/or wind) supported by batteries could surely make sense in some locations, but that the energy of the sun could potentially provide all of world’s energy needs doesn’t necessarily mean that photovoltaics supported by batteries is most efficient way to do it.

Production of 3.4 times demand
Parameter Solar Wind Solar + Wind
Demand 2023 (GWh) 78,866.65
Demand x 3.4 (GWh) 268,146.61
Simulated production (GWh) 268,146.61
Initial in storage (GWh) 3,900 0 0
Maximum storage (GWh) 9,250 1,550 500
Curtailed (GWh)
(Relative to production)
179,270.94
(67%)
184,661.64
(69%)
186,910.53
(70%)
Conversion losses (GWh) 9,927.65 3,068.32 1,869.43

via Trust, yet verify

https://ift.tt/qJf0tSl

November 29, 2024 at 11:13AM