
I was looking up the value of debating the other day, apparently debating is good for us because it fosters critical thinking, persuasive communication, and the ability to analyse complex topics from multiple perspectives. It empowers individuals to articulate their thoughts clearly, defend their viewpoints, and challenge opposing ideas respectfully.
Most everyone can tell me their theory of climate change, they just can’t always explain to me why temperatures at Greenland – at least at Nuuk – increased by some 4 degrees Celsius between 1880 and 1940, only to cool again.
In his book ‘Climate Present, Past and Future’ Hubert Lamb, a past Director of the Climatic Research Unit (CRU), University of East Anglia, wrote about carbon dioxide and the decline in temperatures after 1945 that:
The Observed decline of global temperatures since 1945 implies some other factor exercising about three times as strong an effect (in the opposite direction) as the C02 increase. (page 46)
Of course, more recently the powers that be, most particularly scientists at the CRU have remodelled the 1940s ‘blip’ out of the climate record, and so there is nothing to explain. They prefer this to debating.
The consensus view is now that there was a steady and mostly linear increase in temperatures through the twentieth century.
More recently, Donald Trump, the President of the United States, has been saying that he aims to take control of Greenland, and that Canada should become the 51st state of the US, and he has directed the US military to reclaim the Panama Canal. I have always been interested in the temperature record for Greenland, that like many very northern locations it shows warming from at least 1880 to 1940, then cooling to 1980 and then warming to the present.
Indeed, most temperature series – before they are remodelled for political purposes to show slow and steady warming through the twentieth century – show significant warming and then cooling though the pattern tends to vary regionally.
Another one of the temperature series that puzzles me is Darwin. I was born in Darwin at the General Hospital on 26th August 1963, the maximum temperature recorded on that day was 29.6 degrees Celsius. This value has since been changed to 28.8 degrees Celsius – a drop of 0.8 degrees – ostensibly to ‘correct’ the record.
The day before the city was bombed by the Japanese, on 18th February 1942, a maximum temperature of 31.1 degrees Celsius was recorded – subsequently changed to 30.1, a drop of 1.0 degrees Celsius.
The official record of remodelled temperatures for Darwin, as held by the Australian Bureau of Meteorology begins on 1 January 1910, on that day the maximum temperature was measured as 34.2 degrees Celsius, but the remodelled value incorporated into global datasets is 32.8 degrees Celsius – a difference of 1.4.
Those in positions of authority claim that a mean global increase of 1.5 degrees Celsius will be catastrophic, all the while adjusting down the historic record to almost that much exactly.
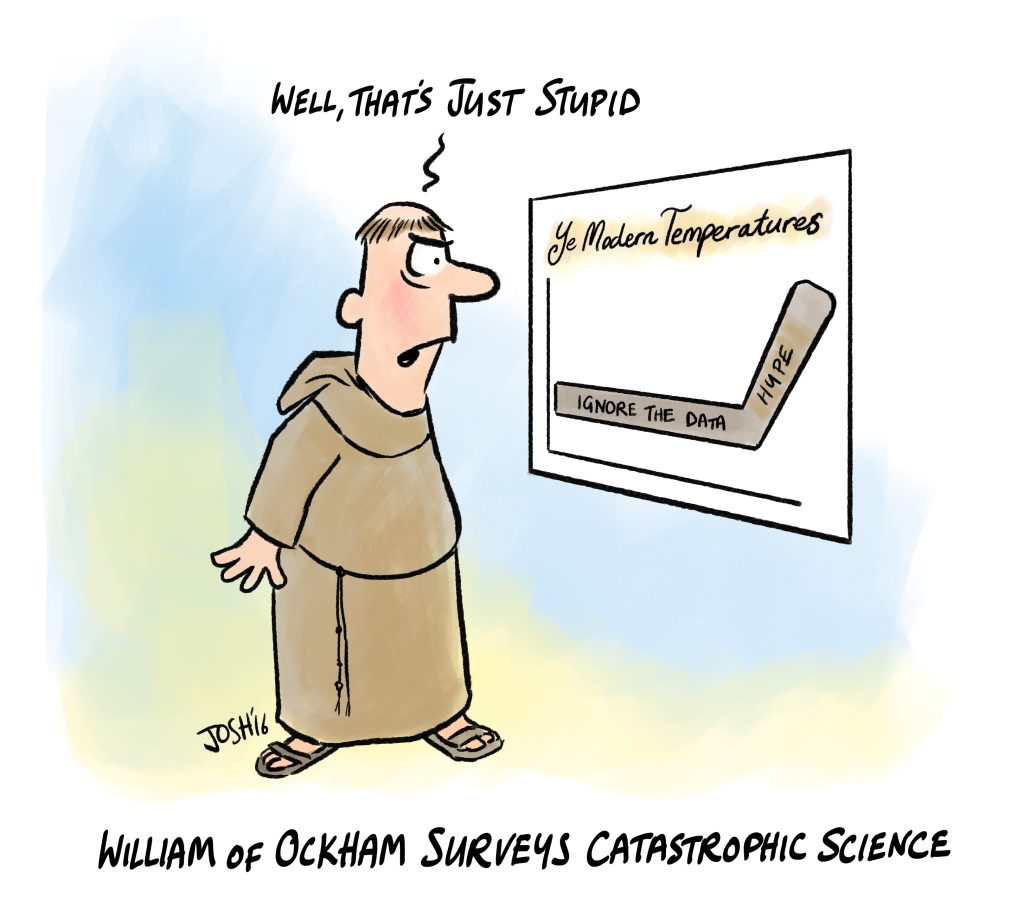
An important philosophical principle in traditional science states that no more things should be presumed to exist than are absolutely necessary. It is often referred to as ‘Ockham’s Razor’ after an English Franciscan friar and philosopher, William of Ockham (c. 1285–1349). If there is no evidence of systematic errors in the raw temperature measurements, then there is no need to make any adjustments down.
There is no scientifically justifiable reason to remodel the numbers as recorded at Darwin, yet that is what they do. The further back I go in time the more the numbers are adjusted down giving the impression that it is getting hotter and hotter at Darwin, where I was born, simply by cooling the past more, and more and more.
Eventually when all the numbers are assembled, they show what could be described as steady increase. That is the hype.
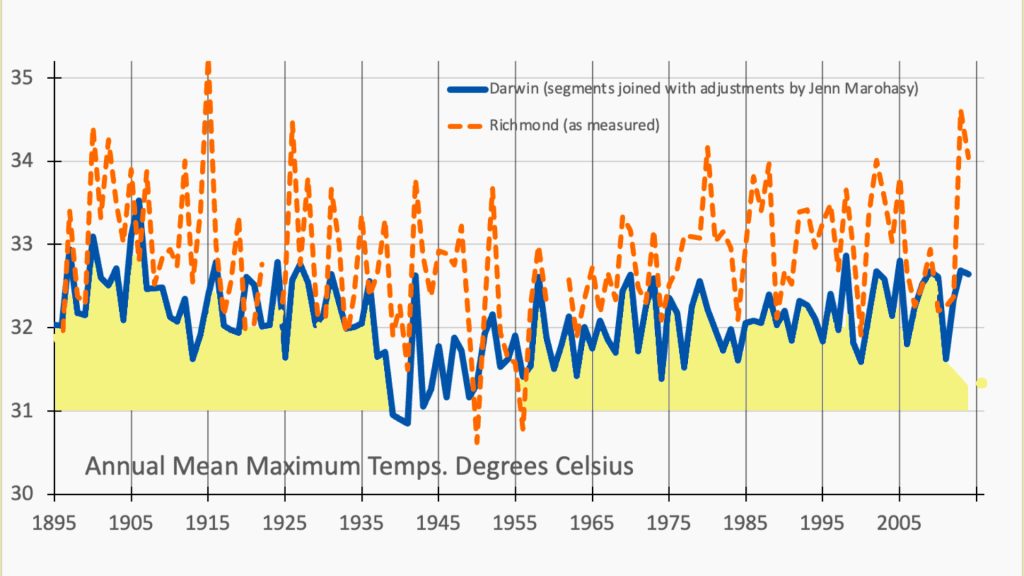
When I compile the series for Darwin – there is no one long continuous series because temperatures were first recorded at the post office and subsequently at the airport – it is the case that there is statistically significant cooling of 2.4 degrees Celsius from 1985 to 1941. This is quite different from the situation at Nuuk, Greenland. The Darwin record, however, is consistent with other long maximum temperature series for other locations in northern and eastern Australia.
I assume the regional variation, including between Nuuk and Darwin, is at least in part a consequence of the position of these particular landmasses relative to ocean currents and also climate zones. (I have very much appreciated recent correspondence from George Angus suggesting I consider the Koppen-Geiger maps as I attempt to explain climate variability and change. Certainly, the distribution of the greenhouse gas water vapour is more consistent with this classification system than is carbon dioxide.) What else?
On Saturday, I have my first solo Zoom as part of the series I began last December variously called ‘How Climate Works’, ‘Towards a New Theory of Climate Change’ or more provocatively ‘My New Theory of Climate Resilience’.
The first Zoom was an interview with Bill Kininmonth about how convection in massive anvil clouds prevents the tropical oceans from overheating, and my second Zoom was an interview with Ivan Kennedy suggesting, amongst other things, that the constancy of seasonal variations in atmospheric carbon dioxide as measured at Mauna Loa, is more consistent with the overall annual increase being from ocean degassing. Indeed, I would now go as far as to suggest that fossil fuel derived carbon dioxide is almost totally absorbed locally in the year it is emitted. Never mind all the hype.
Anyway, I am very grateful to everyone who has already subscribed for the Zooms on Saturday, there are three sessions. So far there are nearly 50 subscribed for the first session, ‘Calling Home’, more than 20 subscribed for ‘Calling London’ and more than 10 subscribed for ‘Calling Houston’.
As homework, I would be keen for everyone who has subscribed to one of these sessions to think about how they might describe the time series data from Nuuk, and also Darwin, in terms of how they understand climate variability and change. To be sure, I am keen to hear about different theories of climate variability and change and how they can provide some explanation of the patterns of change at Nuuk and also Darwin.
If you haven’t yet subscribed, following are the links to the Zoom Sessions. I hope to be able to discuss and debate these issues with you in person online this Saturday.
SESSION NO. 1. CALLING HOME
When: Mar 13, 2025 12:00 PM Brisbane
Register in advance for this meeting:
https://us02web.zoom.us/meeting/register/8G7Ze9hSRmG4x1MNbVCvvg
SESSION NO. 2. CALLING LONDON
When: Mar 29, 2025 11:00 AM LONDON [9pm Brisbane time]
Register in advance for this meeting:
https://us02web.zoom.us/meeting/register/AEic7FtGR0-1pprt-EDz8w
SESSION NO. 3. CALLING HOUSTON
When: Mar 29, 2025 03:00 PM Central Time (US and Canada) – [6am next day for me]
Register in advance for this meeting:
https://us02web.zoom.us/meeting/register/tHsbs5CmRYuR4pnrAXiKOg
via Jennifer Marohasy
March 24, 2025 at 11:30PM
