Guest “This bunny just keeps going and going!” by David Middleton
June 2, 2025
Data source: U.S. Energy Information Administration, Short Term Energy Outlook (Table 4a and Table 10b), May 2025 and Enverus Note: L48=U.S. Lower 48 states
Onshore crude oil production in the U.S. Lower 48 states (L48) has more than tripled since January 2010, driven by tight oil production growth in the Permian region. Onshore crude oil production is made up of both legacy oil production, primarily from vertically drilled wells, and newer tight oil production, primarily from horizontally drilled wells.
Legacy production decreased from 2.6 million barrels per day (b/d) in 2010 to 2.1 million b/d in 2024. Over the same period, tight oil production increased from 0.8 million b/d to 8.9 million b/d, accounting for 81% of total onshore L48 oil production in 2024. The Permian accounted for 65% of all tight oil production growth and 51% of L48 oil production in 2024.
Since 2010, U.S. tight oil production within and outside of the Permian has generally grown. Tight oil production from non-Permian plays decreased from 2015 to 2017 in a period of low oil prices. At the beginning of 2020, tight oil production from the Permian region was essentially equal to tight oil production from all other producing regions in the United States. Permian and non-Permian oil production both fell significantly in response to crude oil prices falling below $50 per barrel (b) related to the COVID-19 pandemic, with production reaching annual lows in May 2020. After 2020, however, production in the Permian increased at a faster rate than production outside the Permian.
Data source: U.S. Energy Information Administration, Short Term Energy Outlook (Table 10b), May 2025 and Enverus Note: WTI=West Texas Intermediate
Tight oil production in the Permian began growing again in 2021 as crude oil prices rose, but production in the non-Permian remained low. After 2020, Permian tight oil production grew at a slower rate than 2017–19, but by December 2024, Permian production reached 5.6 million b/d, up 45% compared with 2020. In contrast, non-Permian tight oil production decreased by 14.9% (0.6 million b/d) based on the annual average oil volumes from 2020 to 2024.
Within the Permian region, the Wolfcamp, Bone Spring, and Spraberry plays produce most of the tight oil, accounting for 99% of Permian tight oil production in 2024. The Wolfcamp play, the largest of the three, has driven growth in the Permian and produced 3.4 million b/d of tight oil in 2024, which was equivalent to production from all other non-Permian tight oil plays combined. The Spraberry and Bone Spring combined produced an average 2.1 million b/d in 2024.
Data source: U.S. Energy Information Administration, Short Term Energy Outlook (Table 10b), May 2025 and Enverus
From 2000 through 2024 the cumulative production from the Permian Basin totaled been 14 billion barrels of crude oil and nearly 40 trillion cubic feet of natural gas. In 2024, the basin accounted for about 2 billion barrels of oil and nearly 7 trillion cubic feet of natural gas production.
Permian Basin oil & gas production and gas/oil ratio (GOR) (2000-2024)
Cue Forrest Gump…
Well… Maybe not…
Let’s look at the Wolfcamp Formation
At 3.4 million barrels per day, The Wolfcamp Formation of the Permian Basin is, by far, the largest single contributor to US oil production.
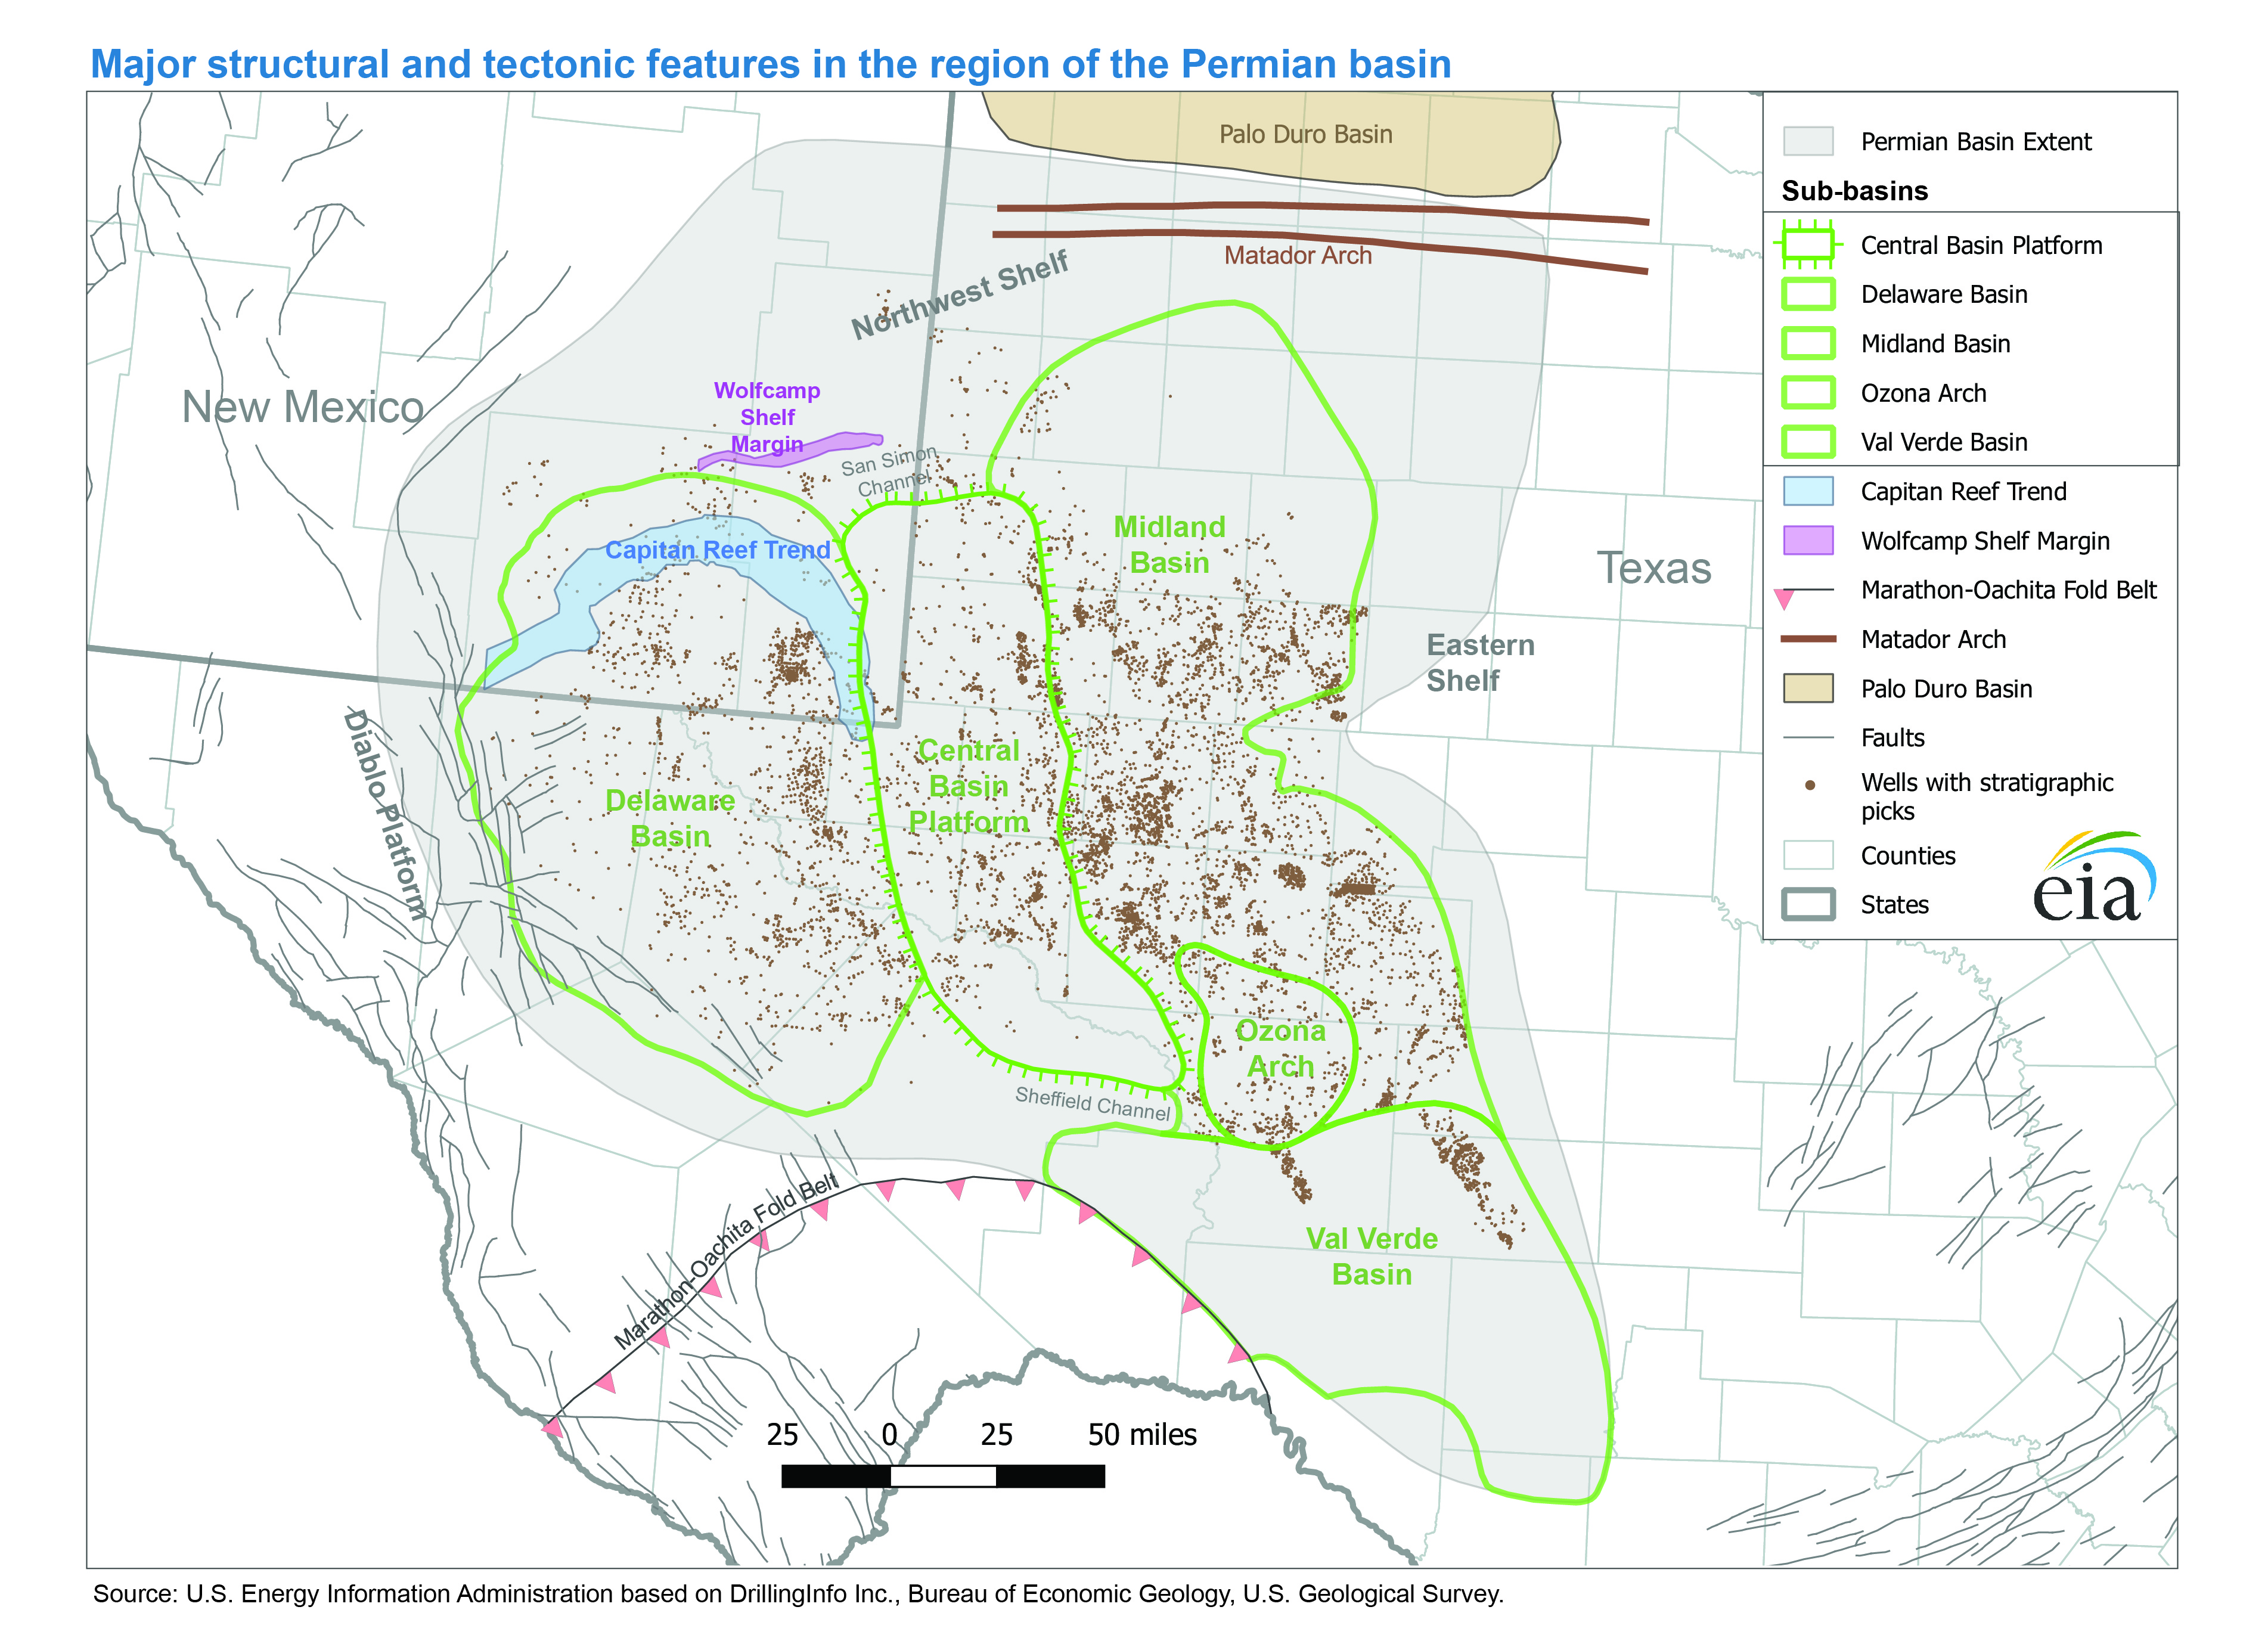
The Wolfcamp Formation was first identified in outcrops in the Wolf Camp Hills, south of the Glass Mountains, north of Marathon, Texas over 100 years ago.
This year marks a centennial celebration for petroleum geologists in more ways than one. A few months after the founding of AAPG in early 1917, the first description of the Wolfcamp Formation was published in the University of Texas Bulletin No. 1753 titled “Notes on the Geology of the Glass Mountains” by J. A. Udden, on Sept. 20, 1917.
Johan August Udden described a series of outcrops in the Wolf Camp Hills that lie at the southern end of the Glass Mountains, approximately 12 miles northeast of the town of Marathon in Brewster County, Texas.
The Wolfcamp is the lowermost and oldest Permian series/formation in the Permian Basin.
The organic-rich “shale” was deposited in an semi-enclosed “epicontinental” sea approximately 290 million years ago.
Regional stratigraphy and lithology of the Wolfcamp formation Wolfcamp formation deposited during late Pennsylvanian through late Wolfcampian time is distributed across the entire Permian Basin. The Wolfcamp formation is a complex unit consisting mostly of organic-rich shale and argillaceous carbonates intervals near the basin edges. Depth, thickness, and lithology vary significantly across the basin extent. Depositional and diagenetic processes control this formation heterogeneity. Stratigraphically, the Wolfcamp is a stacked play with four intervals, designated topdown as the A, B, C, and D benches (Gaswirth, 2017). Porosity of the Wolfcamp Formation varies between 2.0% and 12.0% and averages 6.0%; however, average permeability is as low as 10 millidarcies3, which requires multistage hydraulic fracturing.
Throughout most of the history of the Permian Basin, the organic-rich Wolfcamp was considered one of the primary source rocks for conventional oil & gas reservoirs in the basin. The Wolfcamp was not thought to be a viable reservoir rock due to its low permeability.
The advent of horizontal drilling, coupled with multistage hydraulic fracking since 2010, rapidly led to the Wolf camp becoming the dominant oil reservoir in the United States. In 2016, the USGS estimated a technically recoverable resource of “20 billion barrels of oil, 16 trillion cubic feet of associated natural gas, and 1.6 billion barrels of natural gas liquids” in the Midland Basin alone. Since the USGS assessment, the Permian Basin has yielded 11.6 billion barrels of oil and 33.9 trillion cubic feet of natural gas, with the lion’ share coming from the Wolfcamp… And production is still on the rise.


